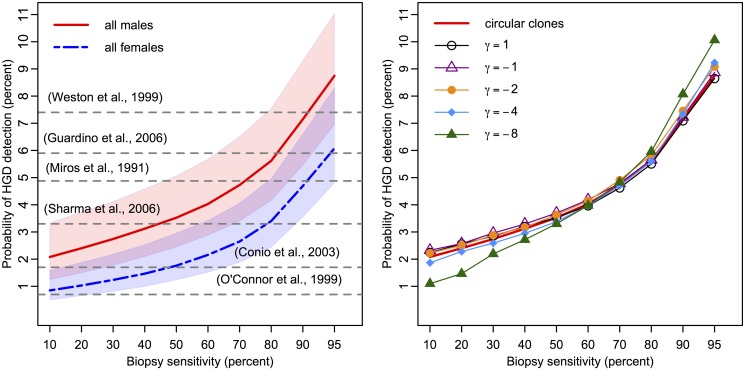
Fig 4. High grade dysplasia prevalences in BE estimated with the MSCE-EAC screening model.
(Left panel) Probability of high grade dysplasia detection among BE patients simulated by the MSCE-EAC screening model for males (red, solid) and females (blue, dash-dotted) at initial screen at age 60 for biopsy sensitivities ranging from 10%–95% and assumed density of σ = 3300 stem cells/mm2 (shaded regions represent sensitivity of results for σ ∈ [2000, 5000]). Since the sensitivity of each study is unknown, literature values for the corresponding probability of HGD detection are depicted as horizontal grey dotted lines at a single percentage level [25, 30–34]. Expected prevalences produced by 100K simulation size of BE patients, shown for males and females. Simulation standard error is less than .001 for all Results. (Right panel) Male HGD prevalences produced by diffusive clone growth on hexagonal BE grid, for diffusivity parameter γ ranging from 1 to −8, versus isotropic, circular clone assumption (red, solid). Solid curve is the same as that shown for males in left panel. Probabilities of finding HGD for spatially simulated diffusive clone growth are shown for σ = 3300 stem cells/mm2 and identical biopsy sensitivities as shown in left panel. As explained in Methods, the assumption of γ = 1 results in almost identical prevalences to the circular clonal growth assumption. Overall, the results from 10K simulated male BE patients yield very similar prevalences regardless of clone shape for mid-range biopsy sensitivities.

