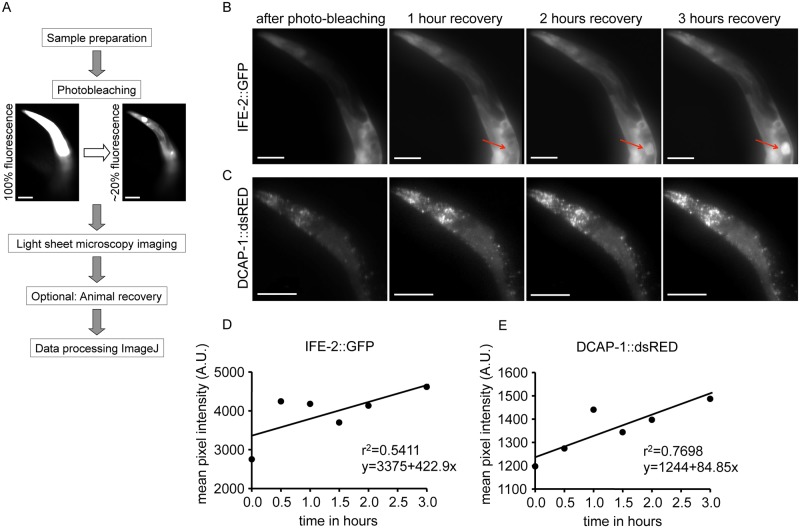
Fig 6. FRAP imaging by low-photobleaching light sheet microscopy.
(A) Workflow for FRAP imaging by light sheet microscopy. After monitoring, the animals can be recovered to assess possible damage induced through the procedure. (B) Representative images of recovery at several time points after photobleaching IFE-2::GFP fluorescence in the anterior part of the animal (see S6 Video). The red arrow indicates a developing embryo within the parental gonad. Size bars correspond to 100μm. (C) Imaging of the anterior region after photobleaching and recovery time points of DCAP-1::dsRED fluorescence. The signal also recovers to the subcellular structures of P bodies (see S7 Video). Size bars correspond to 100μm. (D) IFE-2::GFP and (E) DCAP-1::dsRED quantification of recovering fluorescent intensity of the animals in (B) and (C), respectively. The respective equations describing best-fit lines as well as r2 values for each graph are shown. The line slopes correspond to the first derivative of fluorescent change within a time unit (df/dt) and determine the recovery rate.

