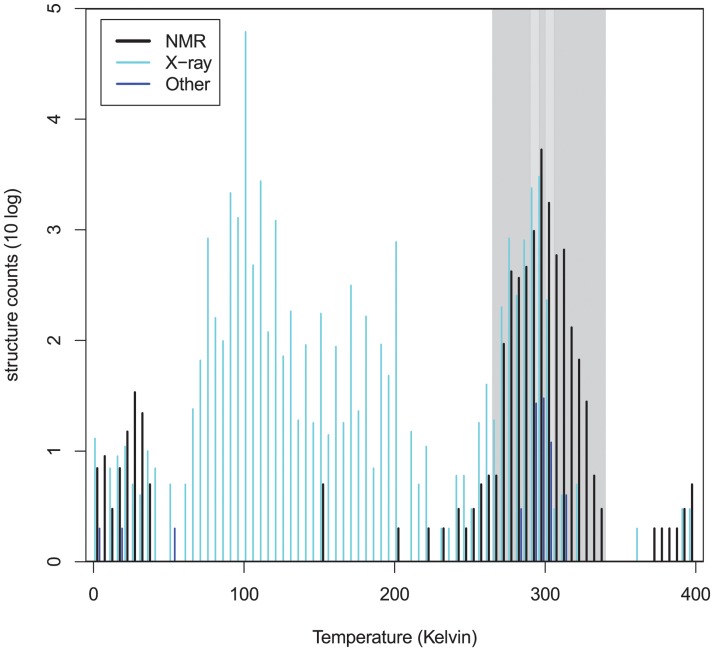
Fig 2. Distribution of temperatures at which experimental protein structures were resolved.
All acquisition temperatures of structures as of April 2014 available in the PDB are shown. The 80,662 X-ray diffraction structures are centred around 100 K, while the 10,969 NMR structures show a peak at room temperature (300 K). Note that the small peak of NMR data just above absolute zero may be temperatures entered in celsius instead of kelvin; this data is not used in this study. Temperature bins, as given in Table 1, are indicated in different shades of grey.

