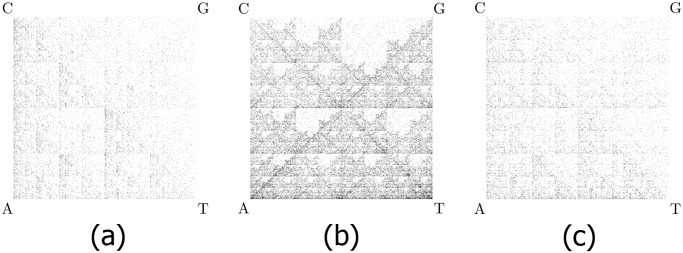
Fig 1. CGR images for three DNA sequences.

(a) Homo sapiens sapiens mtDNA, 16,569 bp; (b) Homo sapiens sapiens chromosome 11, beta-globin region, 73,308 bp; (c) Polypterus endlicherii (fish) mtDNA, 16,632 bp. Observe that chromosomal and mitochondrial DNA from the same species can display different patterns, and also that mtDNA of different species may display visually similar patterns that are however sufficiently different as to be computationally distinguishable.
