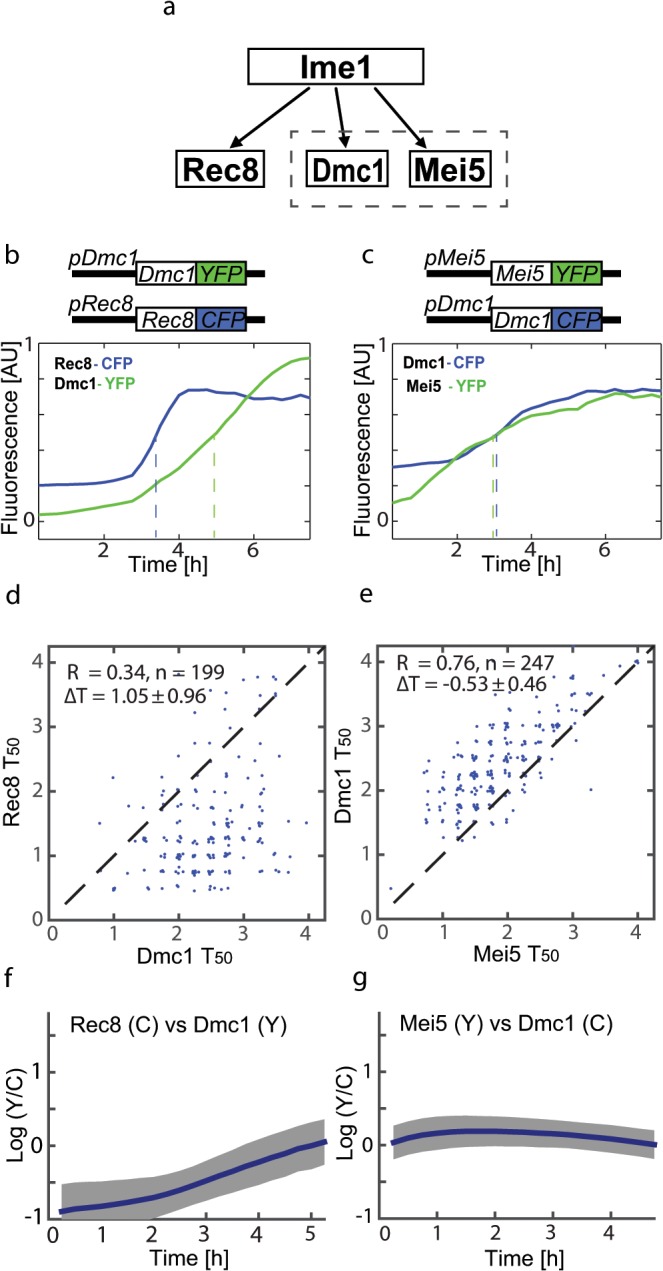
Fig 1. Co-regulated protein pairs show different levels of coordination.

(a) The regulation scheme of Rec8, Dmc1 and Mei5 by Ime1. The dashed box illustrates the joint function of Dmc1 and Mei5. (b,c) Single cell examples for protein levels over time: Rec8-CFP, Dmc1-YFP (b), Dmc1-CFP, Mei5-YFP (c). Dashed lines mark T50 for each marker (see text). Difference in the initial expression level between CFP and YFP comes from the higher signal to noise ratio of the CFP signal, see S1D and S1E Fig. T50 values for protein fusion cells with Dmc1, Rec8 (d) or Dmc1, Mei5 (e) markers. In all plots, y-axis marker is CFP, x-axis is YFP. For each plot, the mean and std of ΔT50 (the distance from the diagonal) are shown. (f,g) Relative abundance over time, measured as log(YFP/CFP) in single cells for the two pairs. Solid line and gray area show mean and standard deviation. Cells were aligned by onset time (see text). For better estimation of variability, the genes are tagged on both chromosomal copies. The co-functional pair (Dmc1, Mei5) displays higher coordination (both in relative abundance and in timing) than the non co-functional pair (Dmc1, Rec8).
