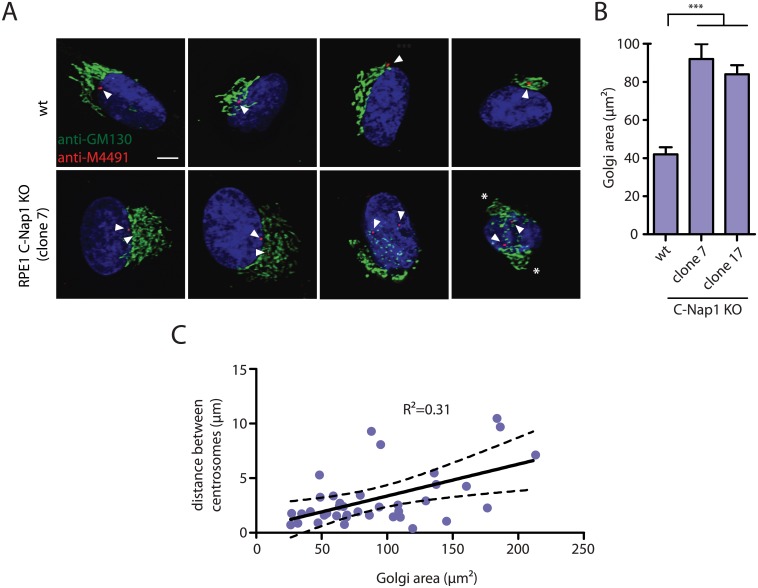
Fig 5. RPE1 C-Nap1 KO cells have Golgi organization defects.
(A) Interphase RPE1 wt and RPE1 C-Nap1 KO cells were fixed and stained with the indicated antibodies. DNA was stained with DAPI. Arrowheads mark the position of the two centrosomes of an interphase cell. The white asterisks in the right picture highlight two well separated Golgi stacks. Size bar: 5 μm. (B) The Golgi area that is occupied by cells in (A) was quantified. The Golgi of RPE1 C-Nap1 KO cells occupies a two-fold larger area then the Golgi of RPE1 wt cells. N = 30. Bars are SEM. *** p<0.001. (C) Correlation analysis between Golgi area and centrosome distance. Data from (A) were analyzed as described in Materials and Methods. The dashed lines indicate 95% confidence interval. N = 30.

