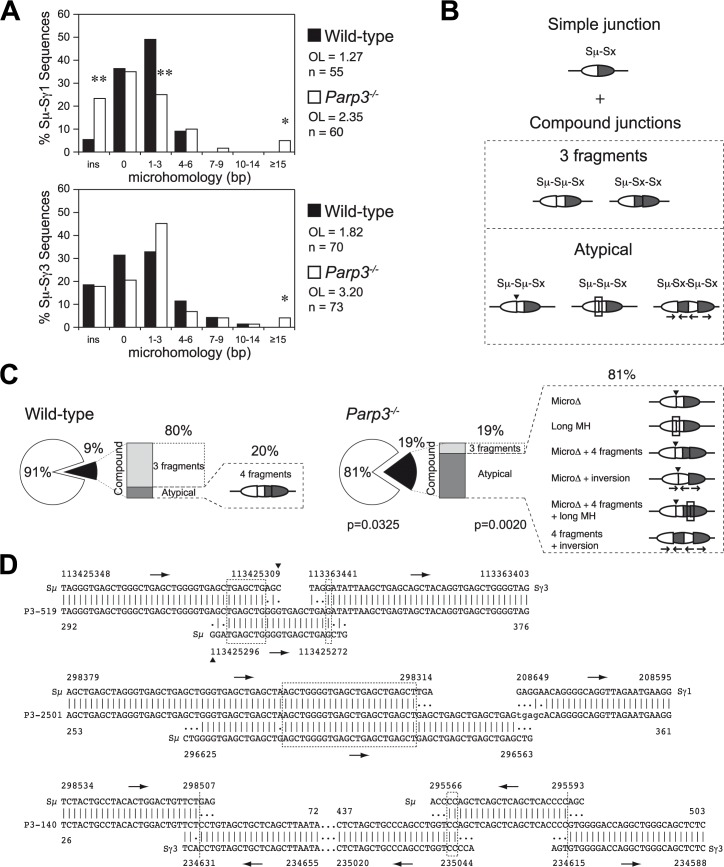
Fig 4. Altered end-joining and enhanced DNA damage at switch regions in Parp3-/- B cells.
(A) Length of microhomologies in base pairs (bp) at Sμ -Sγ1 and Sμ-Sγ3 switch junctions obtained from wild-type (black bars) and Parp3 -/- (white bars) B cells. Bar graphs show the percentage of switch junction sequences with indicated microhomology. Overlap (OL) was determined by identifying the longest region at the switch junction with perfect uninterrupted donor/acceptor homology. Sequences with insertions at the junction were not included in the calculation. n indicates the number of junctions analyzed. Significant differences relative to wild-type controls were determined by a χ2 test as indicated: *: p≤0.05, **: p≤0.001. (B) Diagram representing switch junctions obtained by PCR. Sμ donor and Sx acceptor switch regions are represented as white and dark grey oval parts, respectively. Simple junctions are defined as bearing the expected Sμ-Sx inter-switch recombination event while compound junctions bear additional intra-switch recombination events in addition to the expected inter-switch recombination (Sμ-Sμ-Sx or Sμ-Sx-Sx junctions). Some compound junctions bear unusual characteristics (atypical), such as microdeletions (MicroΔ) indicated with an arrowhead; long microhomologies (long MH), shown with a rectangle and inversions shown with arrows below switch regions indicating the orientation of the different fragments. (C) Frequency and complexity of compound junctions in wild-type and Parp3 -/- B cells. Pie charts represent the frequency of compound junctions (black portion of the chart; p = 0.0325), and stacked bar charts indicate the frequency of atypical compound junctions (dark grey portion of the bar; p = 0.0020). Atypical compound junctions found in each batch are represented as diagrams, as in (B). Significant differences relative to wild-type controls were determined by a two-tailed Fisher test. (D) Examples of Sμ-Sγ3 or Sμ-Sγ1 switch junctions with unusual insertions obtained from Parp3 -/- B cells. Germline sequences for chromosome 12 (NC_000078.6 for C57BL/6J; NT_114985.3 for 129S1/SvImJ background) are shown above or below each junction sequence, numbers indicate nucleotide positions in the reference sequences and in the junction sequences. Lower-case letters indicate insertions, (|) indicates identity between nucleotides, homology at the junctions is boxed. Arrows indicate the sequence orientation.

