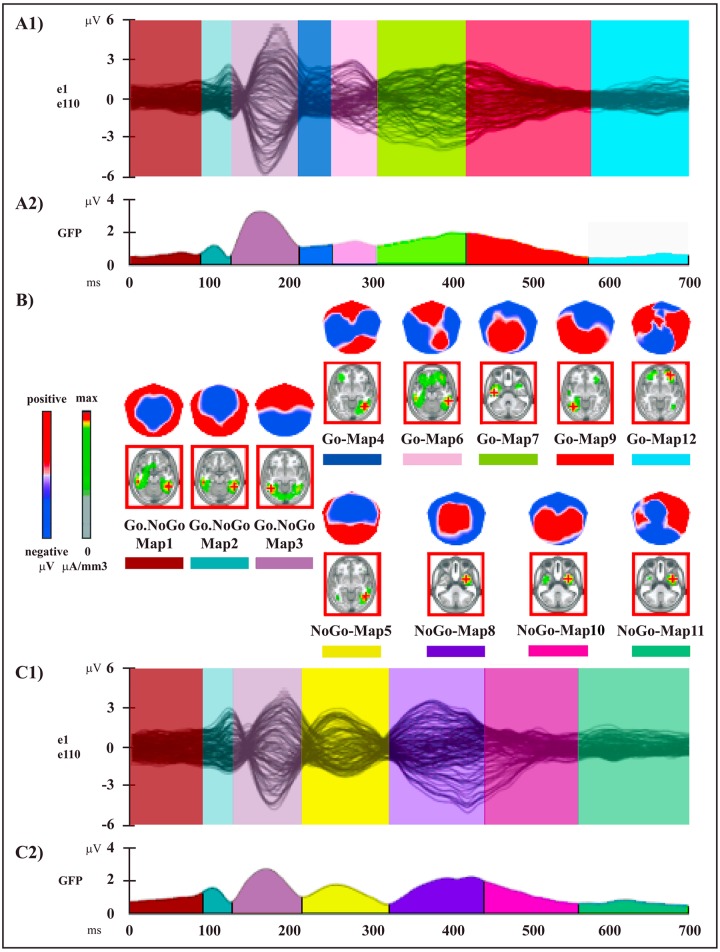
Fig 3. Electrophysiological results over the 700 ms post-stimulus period (stimulus onset: 0 ms) of session A.
(A1 and C1) Group-averaged (n = 15) ERP waveforms for Go (A1) and NoGo (C1) conditions, superimposed across the 110 recording channels (e1–e110). (A2 and C2) Microstate segmentation results for Go (A2) and NoGo (C2) conditions. The temporal distribution of the microstates in each condition revealed by the spatio-temporal segmentation analysis applied on session A dataset is reported on the curve of the global field power (GFP) (i.e., the variance of the 110 channels over the whole scalp at a given time point). Each microstate and its temporal window are indicated by different colors; the same color indicates the same microstate. (B) Mean topographic maps and related mean LAURA source estimations (in red panels) corresponding to each microstate for the group-averaged ERP data. All topographic maps are plotted with nasion upward and left scalp leftward; each map is scaled separately with respect to its maximum and minimum values to optimise the contrast. The current density maxima resulting from source estimations (green: low current density; red: high current density) are rendered on horizontal slices of MNI152 template brain (left hemisphere on the left side); source estimation for each microstate is independently scaled with respect to its maximum value.

