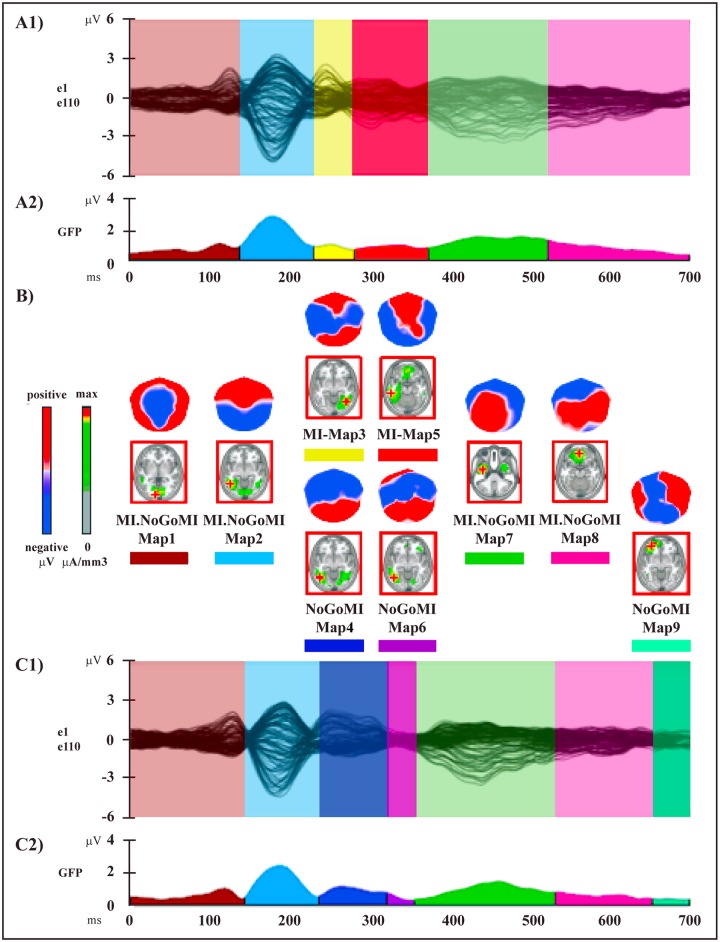
Fig 4. Electrophysiological results over the 700 ms post-stimulus period (stimulus onset: 0 ms) of session B.
(A1 and C1) Group-averaged (n = 15) ERP waveforms for Motor Imagery (MI) (A1) and NoGo Motor Imagery (NoGoMI) (C1) conditions, superimposed across the 110 recording channels (e1–e110). (A2 and C2) Microstate segmentation results for MI (A2) and NoGoMI (C2) conditions. (B) Mean topographic maps and related mean LAURA source estimations (in red panels) corresponding to each microstate for group-averaged ERP data. All other conventions as in Fig 3.

