
Fig 5. Statistical comparisons of LAURA source estimations between condition-specific microstates.
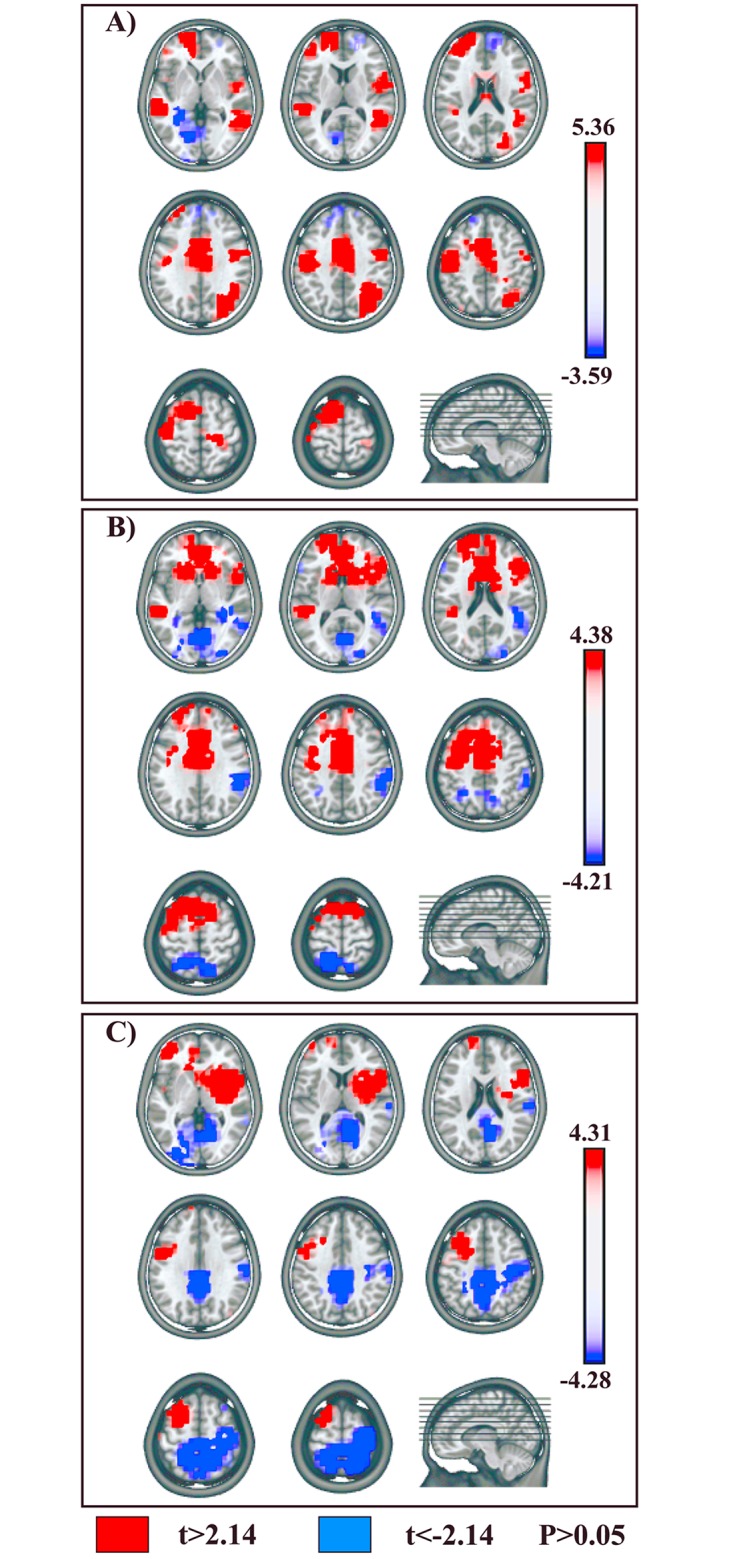
NoGo vs. Go conditions. (A) NoGo-Map 5 vs. Go-Map 6. (B) NoGo-Map 8 vs. Go-Map 7. (C) NoGo-Map 10 vs. Go-Map 9. All significant voxels are colored (t (14) > 2.14 / < -2.14, P < 0.05): positive t-values (red color) indicate higher current source densities in NoGo than in Go condition; negative t-values (blue color) indicate higher current source densities in Go than in NoGo condition. LAURA solutions are rendered on MNI152 template brain.