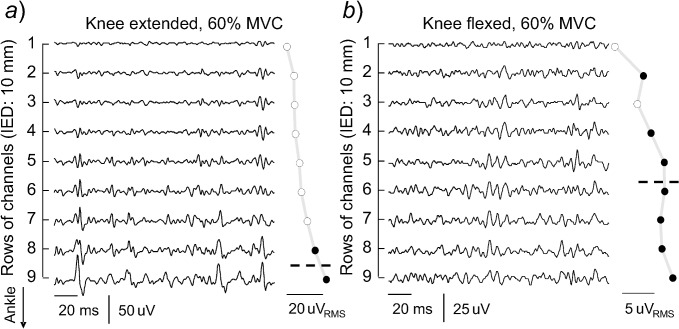
Fig 3. Changes in the surface EMGs with changes in knee position.
A short epoch of raw, surface EMGs is shown during plantar flexion contractions exerted with the knee fully extended (a) and the knee flexed at 90 deg (b). Only nine of the 15 channels in the array were positioned on skin regions covering the MG superficial aponeurosis. The RMS amplitude computed from EMGs detected by each of these nine channels is shown on the right side of each panel, with black circles denoting the channels providing RMS amplitudes greater than 70% of the maximum. Dashed lines indicate the barycentre coordinate computed for these channels.

