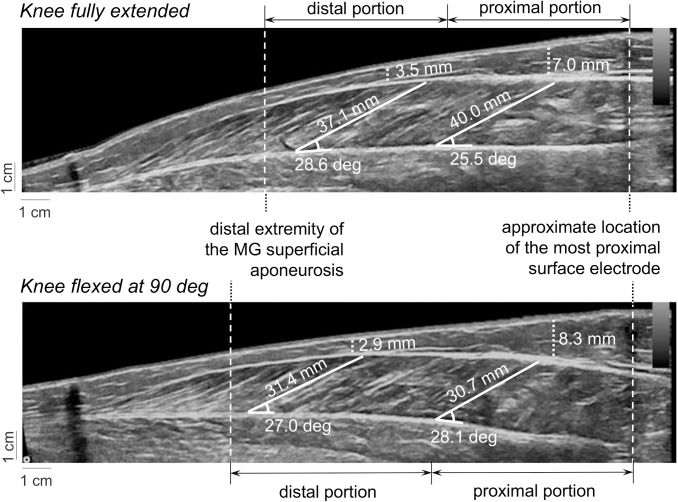
Fig 5. Ultrasound images and gastrocnemius architecture.
The images shown in the top and bottom panels were collected with knee fully extended and flexed at 90 deg, respectively. Dashed lines superimposed on the images indicate the MG portion analysed, from the distal extremity of the superficial aponeurosis to the position of the most proximal electrode (see Fig 1). Dotted lines indicate estimates of fat thickness. Pennation angles were estimated from each pair of white, solid lines; these lines were placed in correspondence of the deep aponeurosis and MG fascicles.

