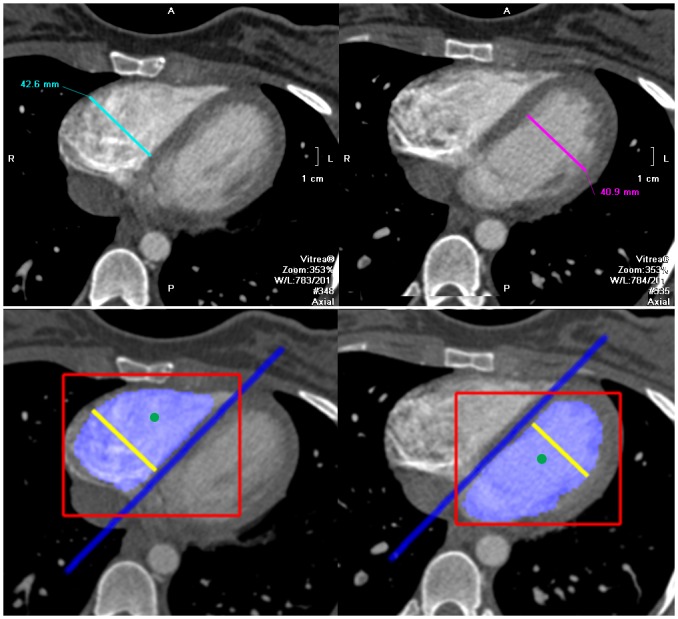
Fig 2. Axial images of a computed tomography pulmonary angiography of a 27 years old female with acute pulmonary embolism.

Top row: manually estimated axial ventricular diameters. Bottom row: automatically estimated axial ventricular diameters and depiction of the different steps followed to compute them: ventricle detection (red boxes), seed positioning (green dots), interventricular septum estimation (blue line), ventricle segmentation (blue areas) and ventricular diameter estimation (yellow lines).
