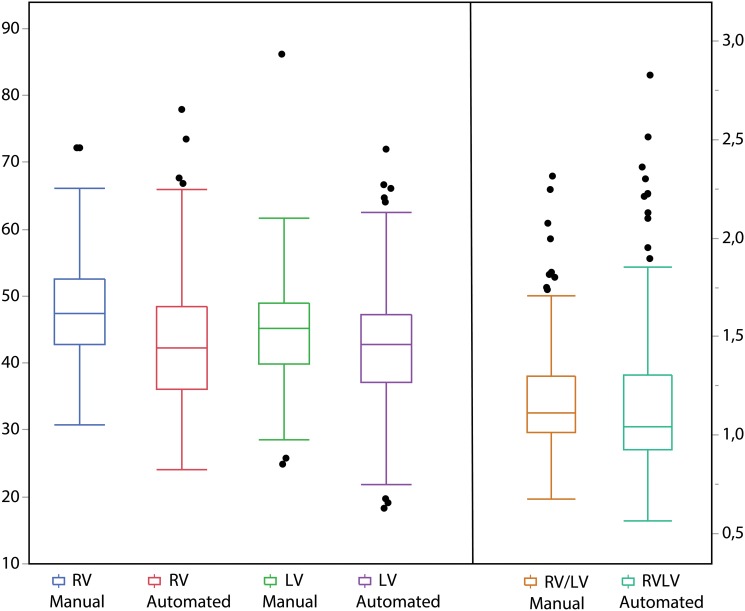
Fig 4. Tukey outlier box plot of manually and automated extracted ventricular diameters and diameter ratios.
The box is placed at the median of the distribution. Top and bottom limits of the boxes represent 1st and 3rd quartiles of the data respectively. Whiskers length is 1.5 inter-quartile distances. Individual dots are considered outliers. While both RV and LV are underestimated by the automated method, the manually and automated estimated ratios are not significantly different, as shown in Table 1.

