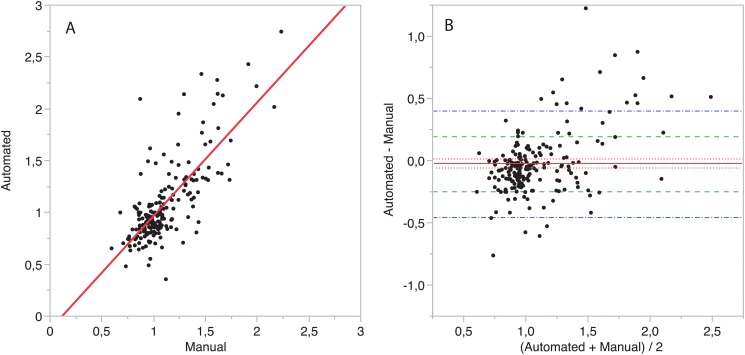
Fig 5. Comparison of automated and manually computed RV/LV diameter ratios.
A) Correlation plot. A linear model is fitted to the data. The intercept’s value is -0.16, the slope is 1.11, Person’s correlation coefficient is R = 0.81, 95% CI [0.76–0.86]. B) Bland-Altman comparison. The mean difference is -0.023 (95% CI [-0.061 0.003], p = 0.08), is depicted with a red line and its 95% CI as dotted red lines. Dot-dashed blue line: 95% limits of agreement of manual vs. automated measurement. Dashed green line: 95% CI limits of agreement between two expert readers. 72.1% (132/183) cases are within the limits of inter-reader variability.

