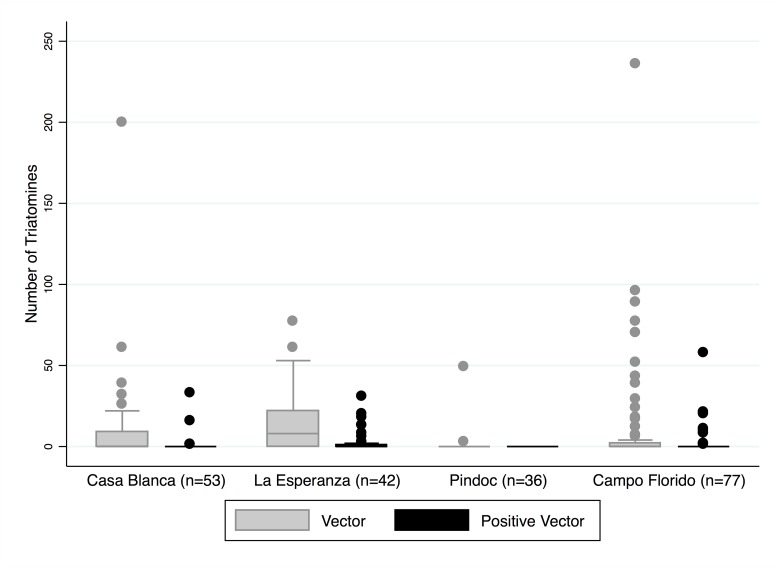
Fig 3. Box plots illustrating the distribution of total triatomines and T. cruzi positive triatomines by community.
While the majority of houses had zero or few triatomines collected (overall median of 0), some outliers had over 200 collected from their home. The gray shaded box plots represent the total number of vectors per household, and the black box plots represent T. cruzi positive vectors per household.

