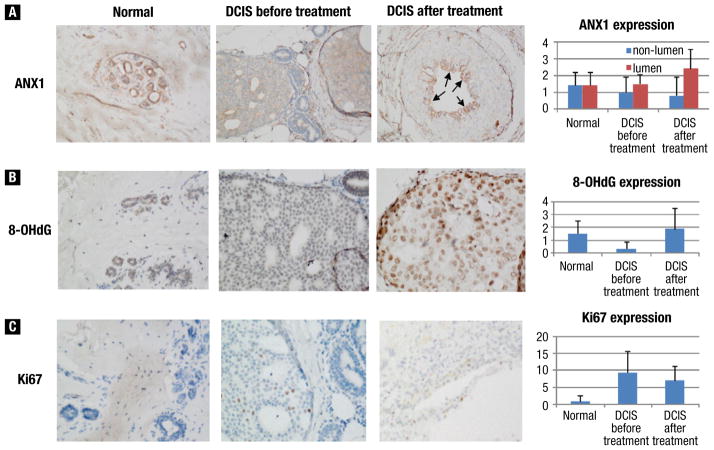
Figure 3.
Representative Images of Biomarker Expression in Normal (original magnification ×20), Ductal Carcinoma In Situ (DCIS) Before (original magnification ×40), and DCIS After Treatment (original magnification ×40). Immunohistochemical Stains for (A) Annexin-1 (ANX1), (B) 8-Hydroxydeoxyguanosine (8-OHdG), and (C) Ki-67. Bar Figures Show the Mean (standard deviation) of Staining Intensity (0, 1, 2, 3 for ANX1 and 8-OHdG) and Percentage of Positive Cells (for Ki-67) of All Cases Reviewed. Note for ANX1, Stain intensities in the Lumen and Nonlumen Areas Were Scored Separately

