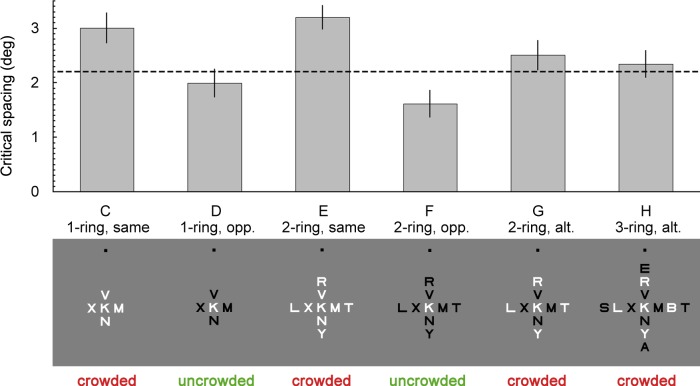
Figure 2.
Results. Critical spacing (in degrees) is measured from the center of the target to the center of a flanker in the innermost ring of flankers. Each gray bar shows the mean (± standard error) critical spacing for the condition presented in the corresponding demo below it. The conditions, C through H, are carried over from Figure 1. The dashed line indicates the spacing of the demos below (equivalent to 2.2° at an eccentricity of 10°). For each condition, the demo is crowded if and only if its spacing (dashed line) is less than the measured critical spacing (gray bar). Error bars indicate plus or minus one standard error of the mean. Three observers.

