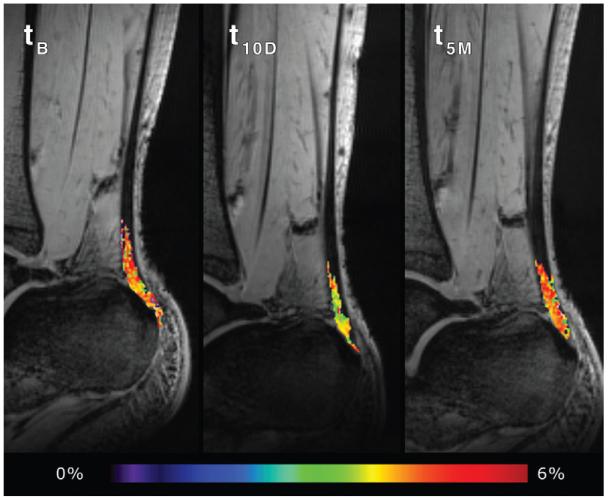
Figure 4.
The GAG CEST map of the Achilles tendon (the segmented pseudocolor-coded tendon is overlaid on CEST image acquired at zero resonant frequency offset) at baseline ciprofloxacin intake (tB), 10 days after ciprofloxacin intake (t10D), and at the 5-month follow-up (t5M). The black areas within the ROI represent the pixels equal to or lower than zero after GAG CEST processing which were excluded from statistics.

