
Figure 4. Single cell analysis of pb axon targeting phenotypes.
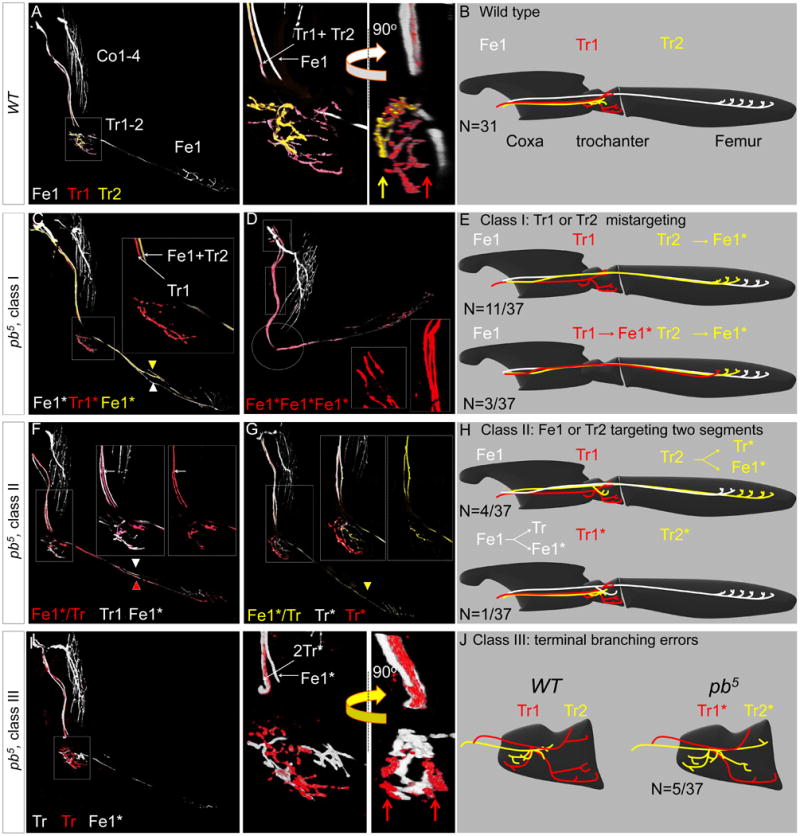
(A, B): Axons of a WT MARCMbow Lin B clone (A) and schematic (B) in which Tr1 and Tr2 were individually labeled. Note the stereotyped separation of the Tr1+Tr2 and Fe1 axons in the magnified image of the trochanter; the 90° rotation shows the medial and lateral positions of the Tr1 (red arrow) and Tr2 (yellow arrow) terminal branches, respectively.
(C-E): Two examples (C, D) and schematics (E) of class I pb mutant phenotypes. In the first example (C), Tr2 targeted the femur instead of the trochanter. In the second example, both Tr1 and Tr2 targeted the femur instead of the trochanter; note the presence of three femur-targeting axons in the magnified (boxed) regions, and the absence of any branching in the trochanter (circles).
(F-H): Two examples (F, G) and schematics (H) of class II pb mutant phenotypes. In both examples, a single labeled MN targeted both the trochanter and the femur. In the first example (F) two MNs targeted the femur, and one of these also targeted the trochanter. In the second example (G), only one MN targeted the femur, and it also targeted the trochanter. Because Tr1 and Tr2 still targeted the trochanter, we can unambiguously determine that Fe1 is the bifurcating MN.
(I, J): In class III pb mutant clones, two MNs target the trochanter, but their terminal branches do not resemble either Tr1 or Tr2. Compare with (A, B). Red arrows point to lateral and medial terminal branches of a single MN, a pattern never observed for wild type Tr1 or Tr2 (compare with panel A).