
Figure 5. Specific walking defects of flies with pb mutant Lin B MARCM clones.
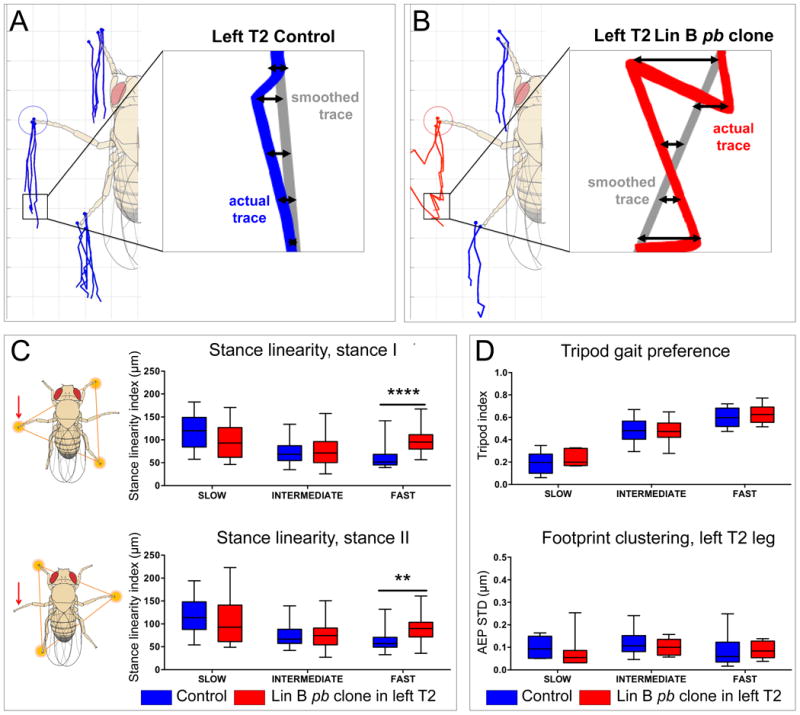
(A, B) Examples of stance traces, which mark the footprint position relative to the center of the fly's body as the fly moves forward, for representative control (A, blue lines) and experimental (B, red lines) flies. Stance linearity is the average distance (double arrows) between the actual stance trace and a ‘smoothed’ trace (gray lines) generated using every five frames, and is thus a measure of how straight the fly's path is; flies that walk perfectly straight would have a stance linearity index of 0 (Mendes et al., 2013). Insets show portions of actual traces from left T2 legs. (C) Stance linearity values averaged for the three legs in tripod stances I (top) and II (bottom) and calculated for both control (blue) and experimental (red) flies that were binned into three speed cohorts. Stance linearity values only differed in the fast speed group, and the difference was larger for tripod stance I, which includes the leg innervated by mutant pb Lin B MNs (red arrow, see Methods) (****p = 0.0001 and **p = 0.004, 2-way ANOVA Sidak's multiple comparisons test).
(D) No differences in tripod index or footprint clustering were observed between control and experimental animals. Tripod index is the fraction of video frames that an animal spends in a tripod configuration (see schematics in (C)). Footprint clustering is the standard deviation from the average of the anterior extreme positions (AEPs; see blue and red circles in A, B) for all steps in a single video (AEP STD). See Mendes et al., 2013 for details.