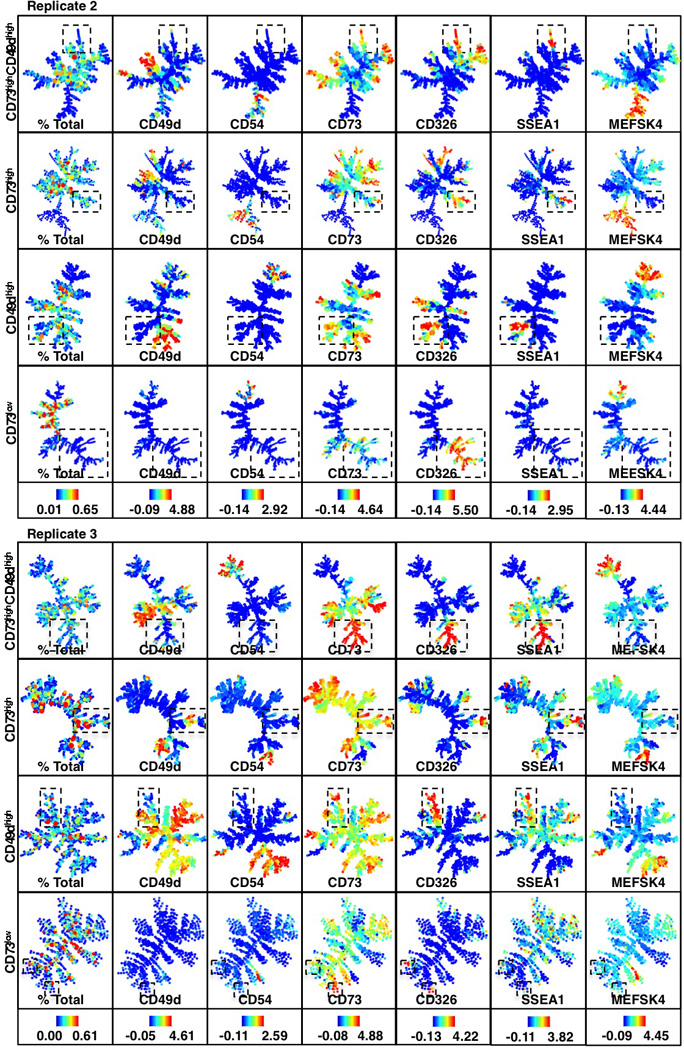
Extended Data Figure 6. Continuation analysis replicates confirm a SSEA1high CD326high branch that is unique to poised populations.

Continuation analysis replicates for reprogramming-prone (CD73high/CD49dhigh, CD73high, CD49dhigh) and non-prone (CD73low) populations. Boxes highlight a SSEA1high CD326high branch that is unique to the poised populations. Colors bars (bottom) represent absolute percentages (left panel) and ArcSinh-transformed counts for each marker.
