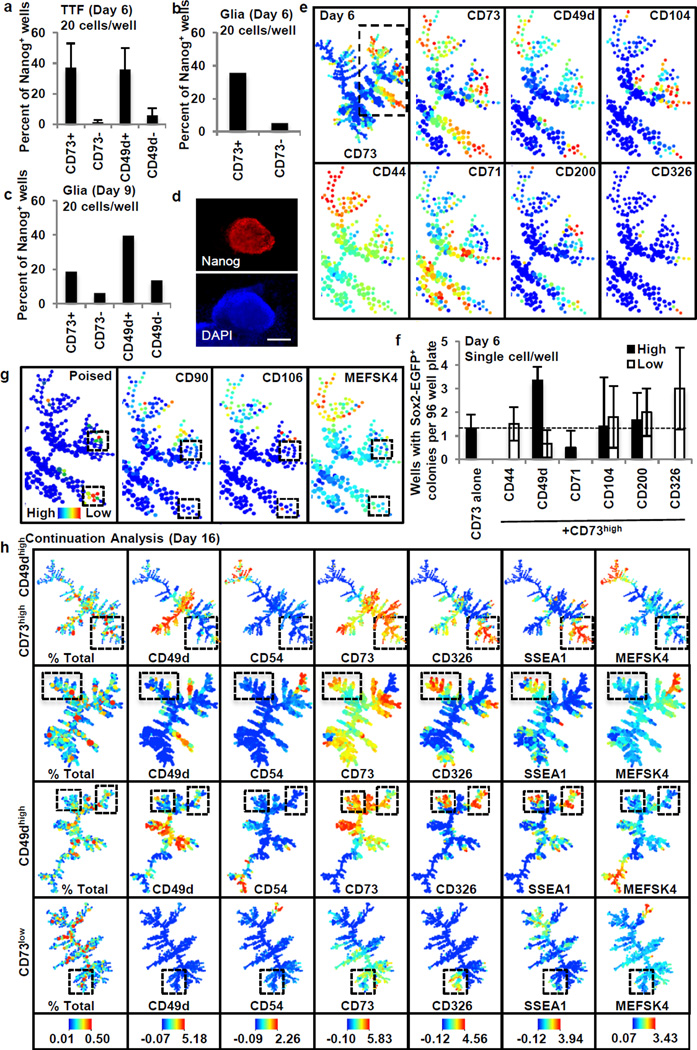
Figure 3. Characterization of CD73high and CD49dhigh intermediates.
a–c, Percent of wells with Nanog expressing cells on day 24 for reprogramming tail tip fibroblasts (TTF) (a) (n=3) and glia (b,c) (n=1, independent primary cells and infections). d, Representative Nanog immunostaining. Scale bar is 200µm. e, Heterogeneously expressed markers in day 6 CD73high population. f, Single cell 96-well assays for day 6 CD73high fraction with additional surface markers (n=3). g, Refined poised signature. Clusters are low for mesenchymal markers. h, Continuation analysis shows SSEA1high CD326high branch unique to poised populations (boxed). All experiments represent independent biological replicates. Error bars represent standard deviation.

