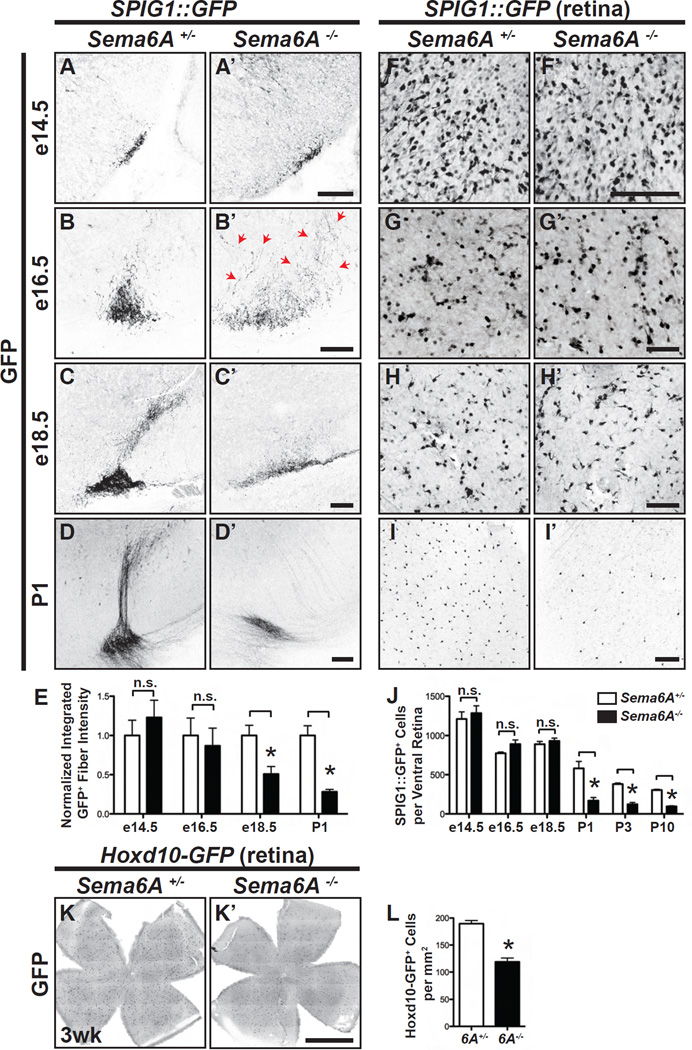
Figure 3. Developmental Characterization of On DSGC-MTN Innervation in Sema6A−/− Mutants.
(A-D’) On DSGC-MTN innervation revealed by SPIG1::GFP in Sema6A+/− (A–D) and Sema6A−/− animals (A’-D’) throughout embryonic development. In control animals, SPIG1::GFP+ RGC axons arrive at the ventral MTN region as early as e14.5 (A), and the progression of MTN innervation is observed from e16.5 (B) to e18.5 (C). In Sema6A−/− mutants, On DSGC axons arrive at the target at e14.5 (A’) and appear normal. However, by e16.5 these axons become defasciculated (red arrows in B’), and exhibit a much broader innervation pattern in the region of the MTN compared to the control. These axons then begin to disappear throughout late embryonic development (C’ and D’; quantification of innervation defects in Figure S3C; n≥3 animals for each developmental stage and for both genotypes analyzed). (E) Quantification of the normalized, integrated, GFP fluorescence to determine fiber density in controls and Sema6A−/− mutants. (F-I’) Characterization of SPIG1::GFP+ On DSGCs in the ventral region of Sema6A+/− (F–I) and Sema6A−/− (F’-I’) retinas. No difference was observed between control and Sema6A−/− mutants at e16.5 or at e18.5 (compare G and G’, H and H’, and quantification in J). However, Sema6A−/− mutants (I’) exhibit dramatically reduced numbers of GFP+ cells at P1 as compared to control (I) (n≥3 animals for each developmental stage and for both genotypes analyzed). (J) Quantification of SPIG1::GFP+ cells in the ventral retina of Sema6A+/− and Sema6A−/− mice. (K and K’) Representative images of a tile-scanned, flat-mounted, Hoxd10-GFP; Sema6A+/− retina (K) and a Hoxd10-GFP; Sema6A−/− retina (K’), showing that Hoxd10-GFP; Sema6A−/− retinas harbor fewer GFP+ RGCs. (L) Quantification of Hoxd10-GFP+ cells in control and Sema6A−/− retinas (n=8 Hoxd10-GFP; Sema6A+/− retinas, and n=6 Hoxd10-GFP; Sema6A−/− retinas). Error bars: SEM. *P<0.0001. Scale bars: 100 µm in (A)-(I’); and 1 mm in (K’) for (K) and (K’).

