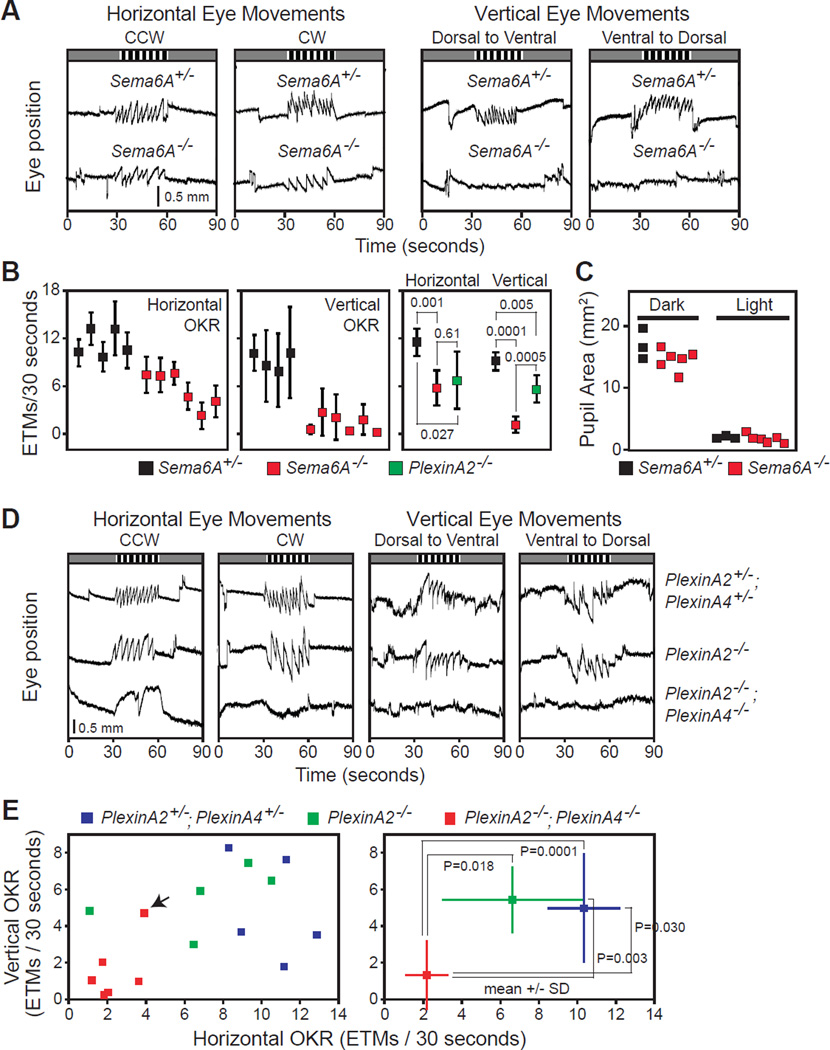
Figure 7. Loss of PlexA2/A4-Sema6A Signaling Compromises Optokinetic Reflex (OKR) Responses.
(A) OKR of Sema6A+/− (top) and Sema6A−/− mice (bottom) measured by infrared imaging of eye position in response to horizontal (left two columns) or vertical (right two columns) motion of black and white stripes during a 30-second time interval (indicated by the striped pattern at the top of each panel). Prior to and following the stimulus interval there are two 30-second periods with no moving stimuli. Asymmetric saw-tooth eye tracking movements (ETMs) illuminate the OKR. Sema6A−/− mutants retain significant horizontal OKR responses (left panel) but exhibit no vertical OKR (right two panels). (B) Quantification of the average number of eye tracking movements (each ETM is defined as a slow tracking movement followed by a rapid saccade) per 30-second interval. Left panel, horizontal OKR of Sema6A+/− and Sema6A−/− animals. Middle panel, vertical OKR in Sema6A+/− and Sema6A−/− animals. Right panel, quantification and comparison of hOKR and vOKR among Sema6A+/−, Sema6A−/−, and PlexA2−/− mice. (C) Pupil light reflex (PLR) test (measured by pupil area, mm2) of Sema6A+/− and Sema6A−/− mice showing that Sema6A−/− mutants have normal PLR responses. (D) Representative horizontal OKR (left two columns) and vertical OKR (right two columns) responses in PlexA2+/−;PlexA4+/− (upper row), PlexA2−/− (middle row), and PlexA2−/−;PlexA4−/− animals (bottom row). PlexA2−/−;PlexA4−/− animals exhibit loss of both horizontal and vertical OKR responses. (E) Quantification of the horizontal and vertical OKRs in PlexA2+/−;PlexA4+/−, PlexA2−/−, and PlexA2−/−;PlexA4−/− animals. Left panel, mean values for each mouse tested for OKR. The single PlexA4−/−;PlexA2−/− mouse that showed significant vertical ETMs (mouse #8191, which shows limited MTN innervation (Figure S8H), is indicated by a black arrow). Right panel, mean±S.D. for each genotype; statistically significant P values are shown.

