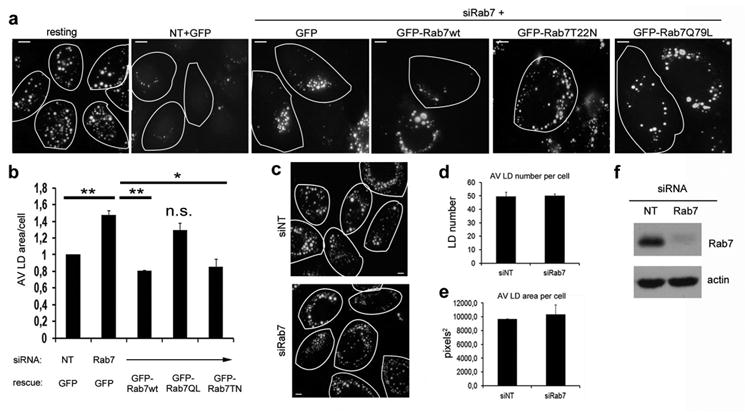
Figure 2. Rab7 depletion impairs starvation-induced LD breakdown but not LD formation.

(a) IF of Hep3B cells treated with control (siNT) or Rab7 siRNA (siRab7), then transfected with either GFP control vector, GFP-Rab7-wt, -Q67L or T22N, loaded overnight with oleate and then starved for 48 h in medium containing 0.1% FBS. LDs were visualized by ORO and the area of LDs per cell was assessed. While control cells metabolize significant numbers of LDs, Rab7-depleted cells do not. This phenotype was rescued by Rab7-wt and the active –Q67L form, but not by the dominant negative –T22N form of Rab7. Encircled cells express GFP alone or GFP-Rab7 as indicated. (b) Quantitation of the average LD area per cell from at least three independent experiments as described in (a). Data are presented as mean ± S.E., p values (**) ≤ 0.004 and (*) = 0.048, respectively. (c) Representative images from a loading experiment in control (siNT) and Rab7 depleted cells (siRab7). 48h post-transfection, cells were loaded with oleate overnight and LDs were stained using ORO. Cell borders are outlined. (d and e) Average LD number (d) and average LD area (e) per cell in Hep3B control cells (siNT) or cells depleted of Rab7 (siRab7). Data are presented as mean ±S.E. and no significant difference in the ability to form LDs was observed between control and Rab7 knockdown cells. (f) Representative blot showing Rab7 knockdown efficiency in Hep3B cells. Scale bars = 10 μm.
