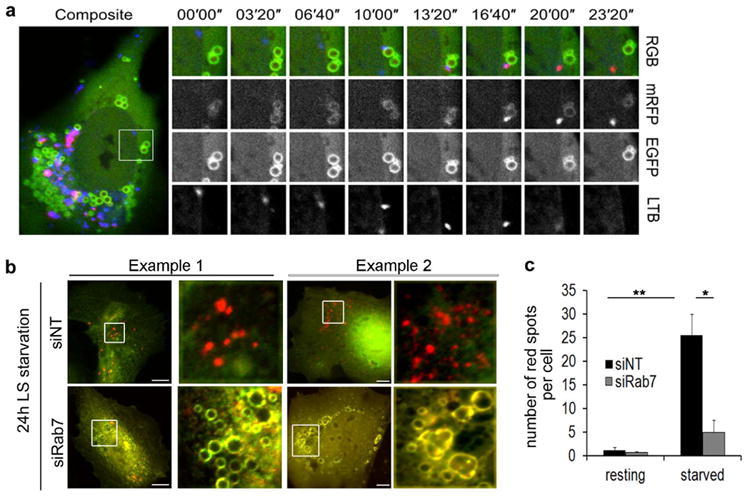
Figure 5. Rab7 depletion inhibits LD-lysosome docking.

(a) Still images taken from a confocal time-lapse series of an oleate loaded Hep3B cell expressing mRFP1-EGFP-PLIN2. The yellow PLIN2 structure gives rise to a “red only” spot by the transient docking of and acidic lysosome (LysoTracker Blue, arrow) that quenches the GFP-portion of the tag. Note the blue to red spectral shift exhibited by the lysosome post docking (16”) that occurs in a “kiss-and-run”-like fashion. (b) Fluorescence images of fixed Hep3B cells, treated with siNT or siRab7 that were transfected to express mRFP1-EGFP-PLIN2, loaded overnight with oleate and then starved for 24h in medium containing 0.1% FBS (LS). In both examples, starvation induces an increase of red PLIN2 puncta, indicative of a lysosomal “sampling” of the PLIN2- reporter protein. This shift is abrogated in the Rab7 knockdown cells which displayed mainly yellow PLIN2 rings reminiscent of the PLIN2 localization in resting cells and indicative of little to no interaction between LDs and lysosomes. Scale bar = 10 μm. (c) Quantitation of three independent experiments as described in (b). Data are presented as mean ± S.E., p values = 0.005 (**) and 0.015 (*), respectively. At least 25 cells per condition were counted.
