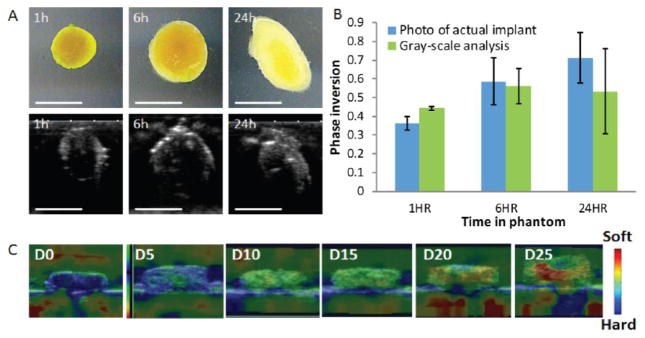
Fig. 1.

Examples of ultrasound in implantable DDS. (A) Representative gray-scale images of the implants over time below photos of the actual implant. Scale bar is 5mm (B) Quantification of phase inversion calculated using photos of actual implants and ultrasound gray-scale analysis. (C) Representative ultrasound elastography images of implants over time indicating implants becoming soft. (Unpublished data).
