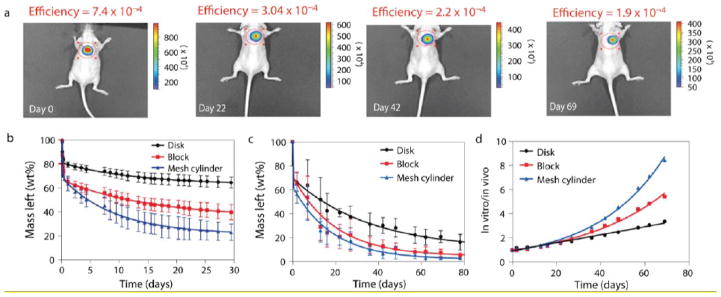
Fig. 3.

In vitro–in vivo erosion profiles of PEG: dextran correlate and vary with material surface area. In vitro and in vivo erosion profiles of PEG: dextran cast in a series of shapes are depicted by tracking the loss of fluorescence intensity with time. (A) The effect of material shape on degradation profile was followed in vivo non-invasively in the dorsal subcutaneous space of mice (disk shaped materials are presented). B–D, The loss of fluorescence signal with time in vitro (B) and in vivo (C) was converted to weight loss and correlated (D). Correlations found between mean values of in vitro and in vivo erosions are indicated. (Adapted from Ref. [76] with permission).
