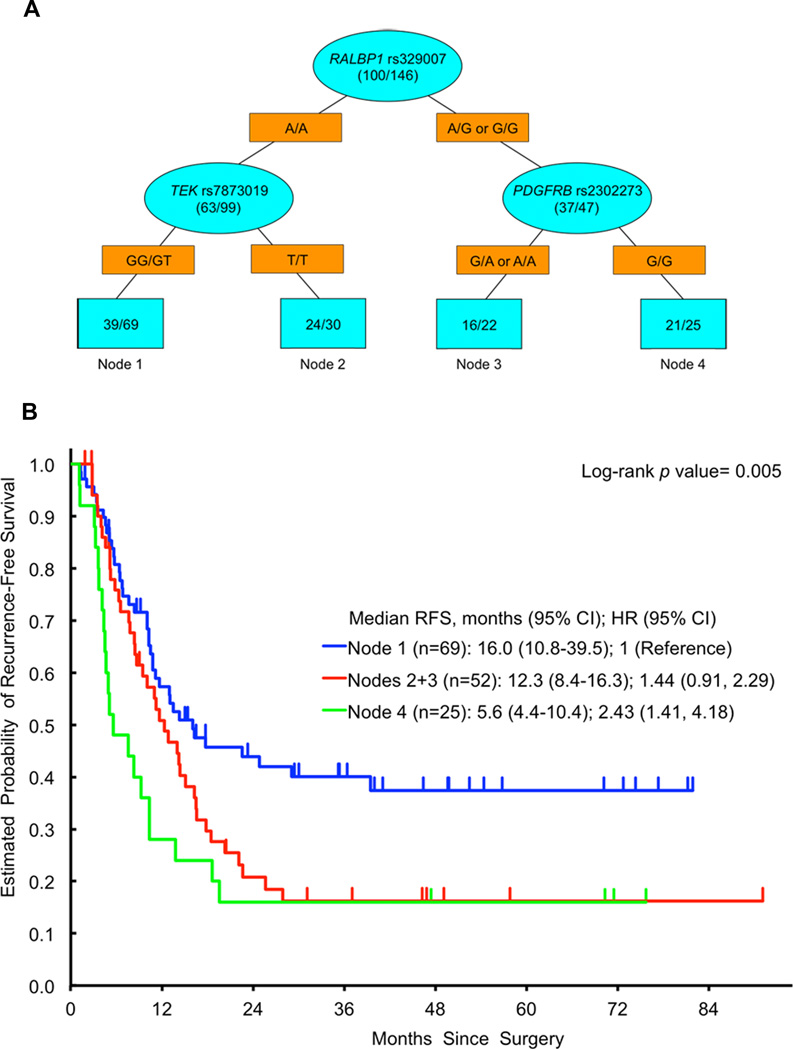
Figure 3.
A Recursive Partitioning for RFS. Blue ovals represent intermediate subgroups; blue squares represent terminal nodes. Yellow rectangles indicate predictive polymorphism. Fractions within nodes indicate patients who relapsed/total patients with that node. Node 1 represents low risk patients; Node 2, 3 represent intermediate risk patients. Node 4 represents high risk patients. B Kaplan Meier curves for RFS nodes

