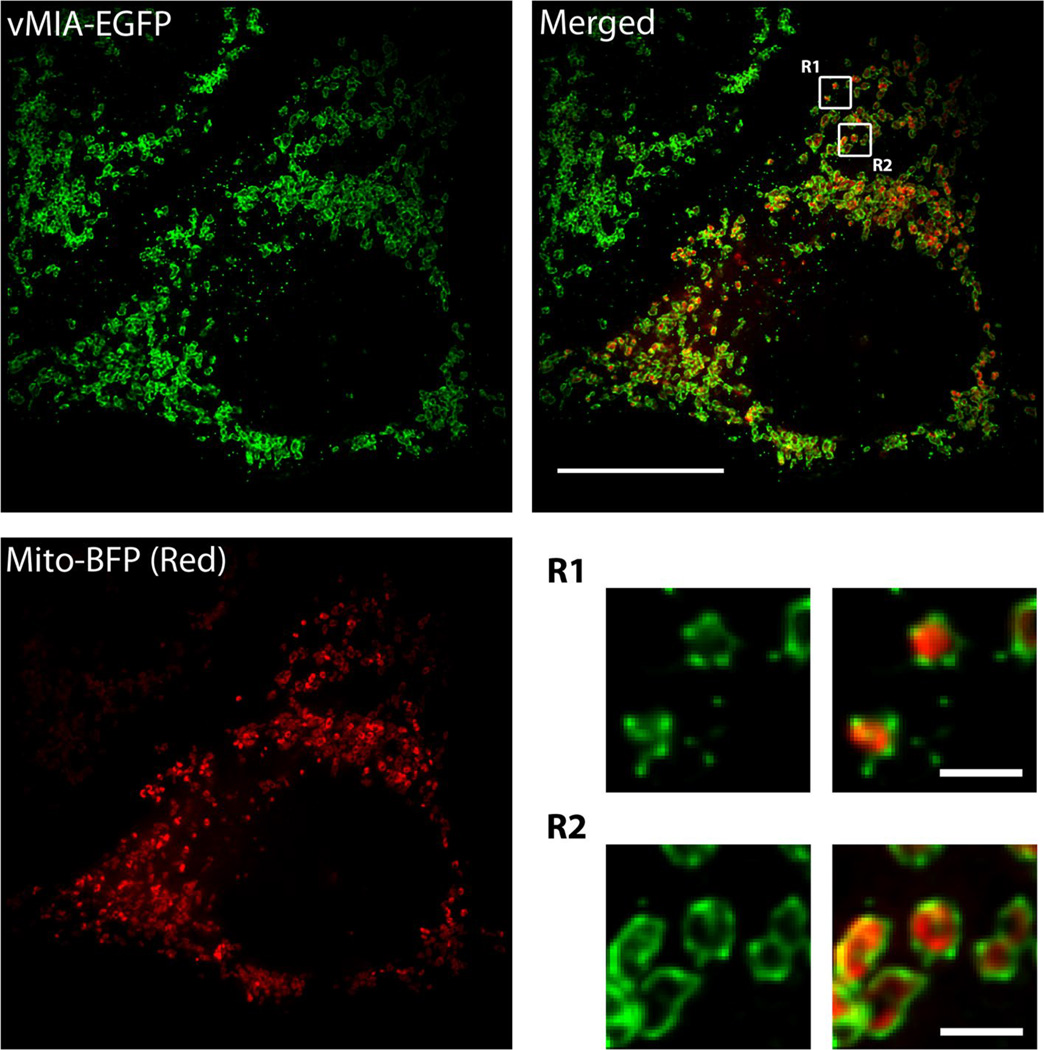
Fig. 4.
Visualization of vMIA clustering on the OMM by MSIM imaging. HeLa cells were transfected with vectors expressing vMIA-EGFP (green) and mitochondrial marker Mito-BFP (pseudocolored red) using Lipofectamine 2000. Transfected cells were fixed with 4 % paraformaldehyde and imaged using MSIM as described [93]. Zoom of the regions R1 and 2 on the merged image show the clustered distribution of vMIA-EGFP at the OMM. The scale bars represent 15 µm on the merged full-size image and 1 µm on the zoomed images

