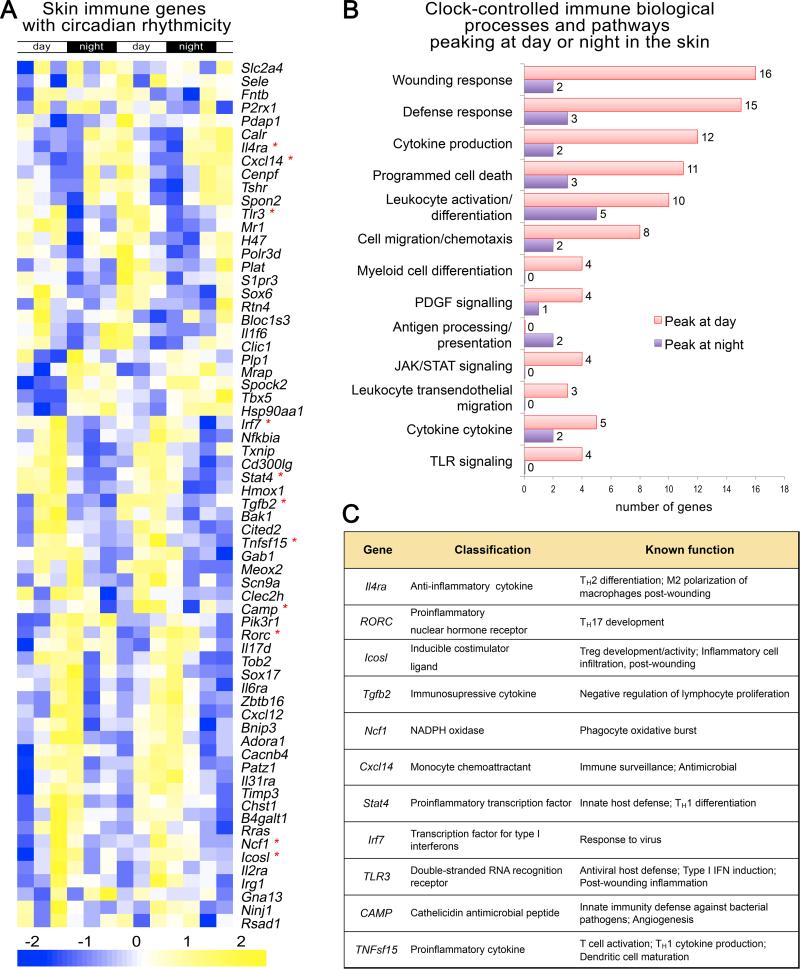
Figure 4. Many immune genes in skin display circadian rhythmicity.
(A) A heat map showing the expression of immune-related genes in telogen over two days based on previously published whole skin microarray datasets generated in mice (Geyfman et al., 2012). Multiple genes with established immune function exhibit circadian expression. The day and night periods are indicated at the top and the gene expression strength indicated at the bottom. (B) Shown is the gene ontology for the circadian immune genes. The number at the end of bars refers to the number of genes with the specific function. Genes that peak at day or night are indicated with the pink and purple color. (C) The function of selective immune genes is indicated. These genes are marked with an asterix in A.

