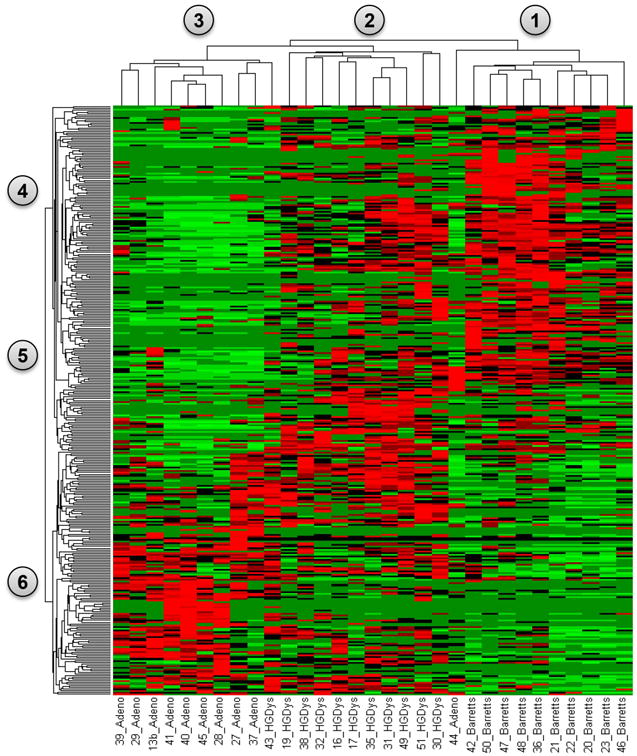
Figure 2.

A heat map representation from a supervised clustering analysis of significantly differentially abundant proteins identified from BE in column grouping 1 (n=10), HGD in column grouping 2 (n=11) and EAC tissues in column grouping 3 (n=10). Individually significant proteins are represented in row groups 4, 5 and 6. Protein abundances are plotted as mean observed spectral counts for each tissue type where red represents proteins with a normalized spectral count value greater than 1.5 and green represents values less than 1.5. Significance was determined by the Kruskal-Wallis test. The results demonstrate clear patterns of protein abundance that can be seen correlating with BE (nodes 1&4), HGD (nodes 2&5) and EAC (nodes 3&6).
