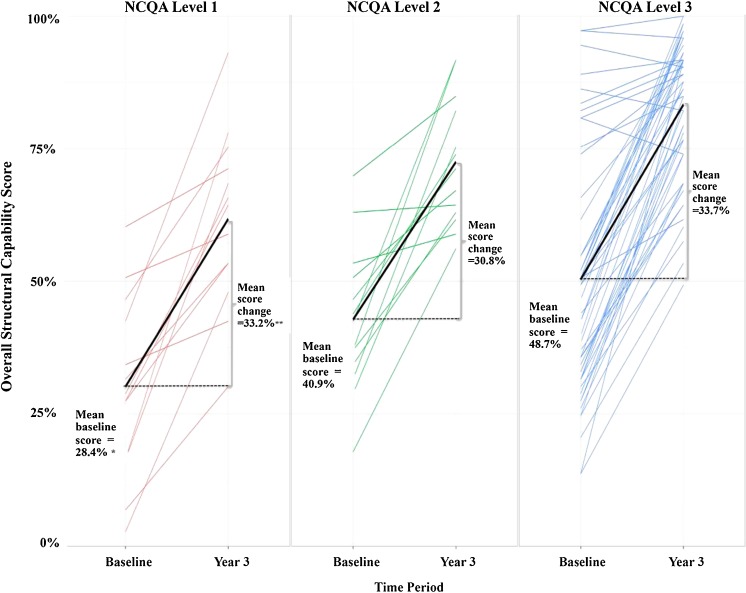
Figure 1.
Relationship between baseline-to-year-3 changes in overall structural capability scores and year-3 NCQA recognition levels. Note: each colored line represents baseline and year-3 scores for one practice. The black lines represent mean baseline and year-3 scores for practices with the indicated NCQA recognition level. One practice that did not receive NCQA recognition is excluded from the figure. *Mean baseline overall structural capability scores (28.4 % for NCQA level 1, 40.9 % for NCQA level 2, 48.7 % for NCQA level 3) differed significantly across NCQA recognition levels (p value = 0.001). **Mean baseline-to-year-3 change in overall structural capability scores (33.2 % for NCQA level 1, 30.8 % for NCQA level 2, 33.7 % for NCQA level 3) did not significantly differ across NCQA recognition levels (p value = 0.88).

