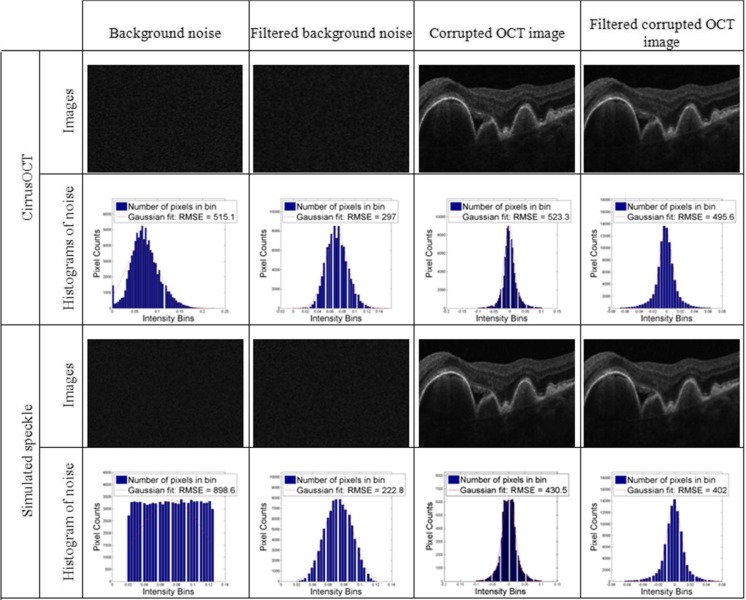
Fig. 1.
Example images and histograms of background signal in OCT (first to columns on the left) and a retina sample (two columns on the right), before and after median filtering. The first and third rows display the OCT B-scan images and their respective histograms are displayed under them (second and third rows)

