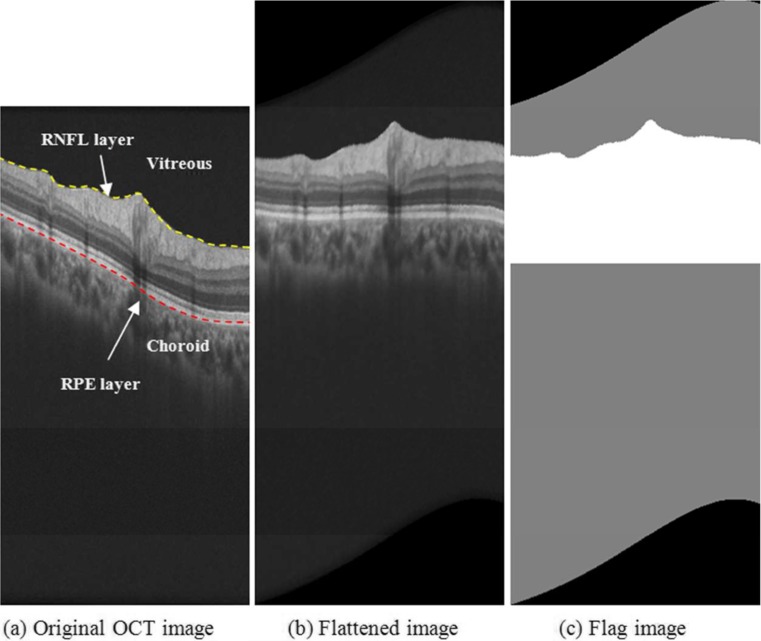
Fig. 2.
Optimization of neighborhood shape for RPE layer. a Identifies the RNFL boundary, RPE layer, and vitreous and choroid regions in an original B-scan. b Displays the same example B-scan after the flattening step according to the location of the RPE layer. c Shows the identified regions of the B-scan where whether homogeneity similarity denoising (white region) or bilateral filtering (gray region) was employed

