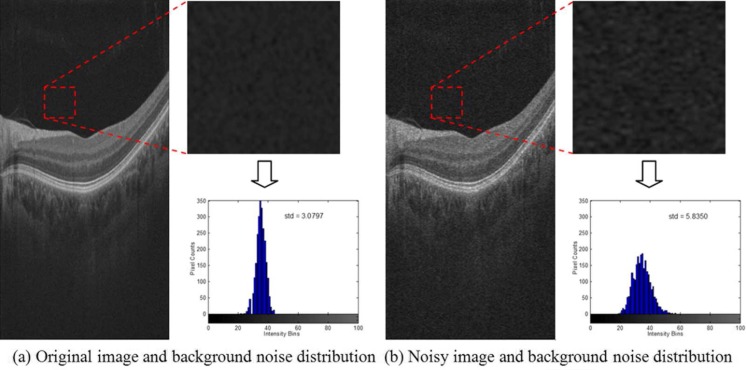
Fig. 3.
Generation of a synthetic noisy OCT image. a Displays a downsampled high-resolution image. The dashed red square indicates an area identified as mainly background and the histogram of such area is also displayed. b Result of adding synthetic noise obtained from Cirrus OCT hardware to the image displayed in (a)

