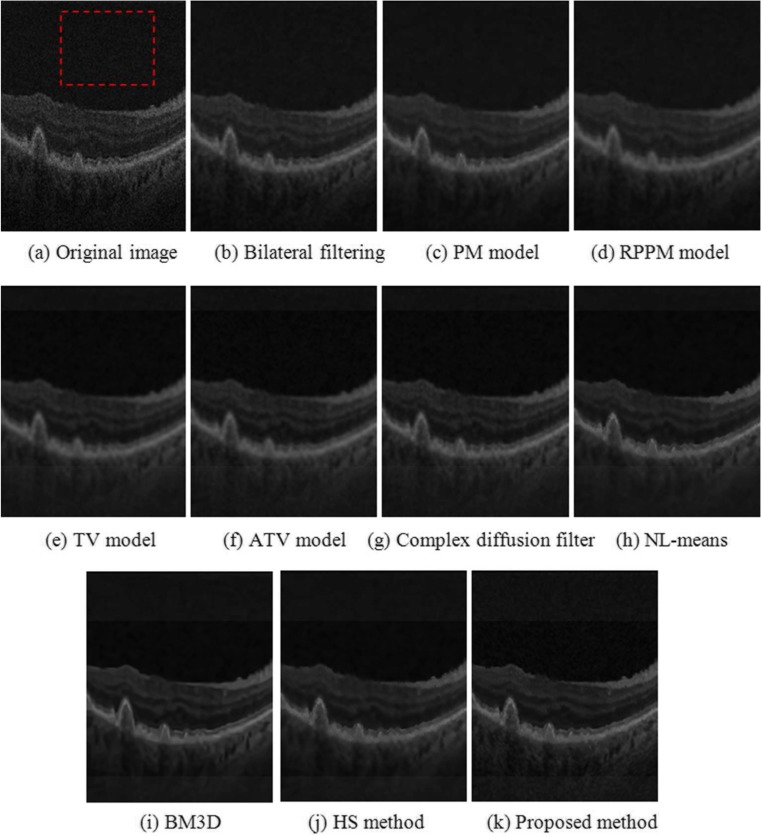
Fig. 4.
Denoising results obtained from different methods in a sample B-scan of a real OCT retinal image. a Original B-scan. The dashed red square indicates an example location identified as background and used to adjust the denoising methods to produce similar results in terms of standard deviation measured in background pixels. b to k Results obtained from the different denoised methods investigated

