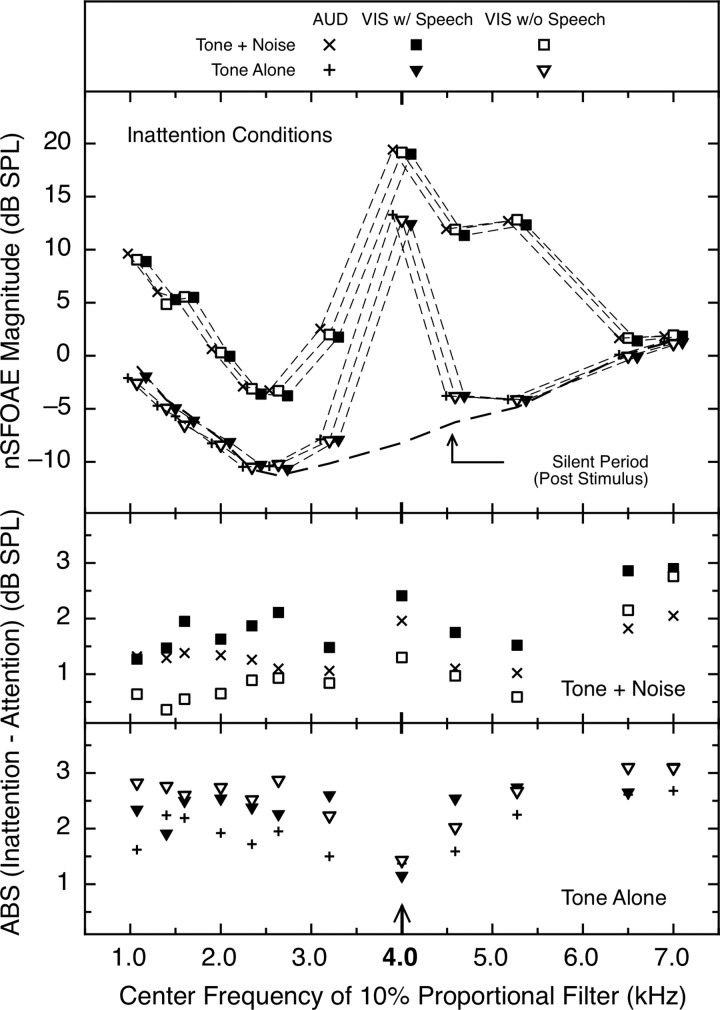
FIG. 8.
Attentional effects across the spectrum. (top) Average magnitude of the asymptotic nSFOAE response for the inattention conditions in the auditory- and visual-attention studies. Data are shown for the tone-alone, tone-plus-noise, and silent periods of the eliciting stimuli. The nSFOAE-eliciting stimulus was a moderate 4.0-kHz tone and a weak wideband noise. The values shown were obtained by varying the center frequency of the analysis filter and repeating the moving-window analysis. All values have been corrected for the rise times of those different filters (see Walsh et al., 2014a,b), and for clarity, entries have been slightly displaced laterally. The noise floor of the measurement system lay several decibels below the values from the silent period. (Middle) and (bottom) Across-subject means of the absolute values (ABS) of the differences between the inattention and attention conditions for the tone-plus-noise and tone-alone portions of the nSFOAE responses, respectively. For the auditory-attention study, the average standard error of the differences of the means (Inattention – Attention) across subjects and frequencies was 0.33 dB; for the visual-attention study, it was 0.37. For the auditory-attention conditions there were eight subjects; for the two visual-attention conditions only seven of those subjects completed the study.

