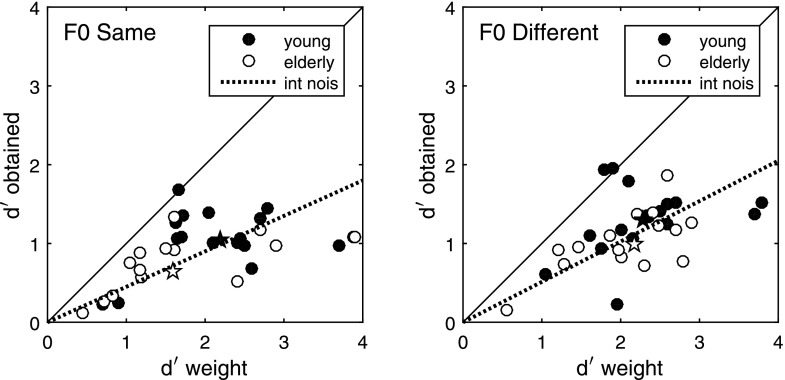
Fig. 1.
Values of d′ obtained are plotted against computed values of d′weight for both young (solid symbols) and elderly (open symbols) adults for F0-same (left panel) and F0-different (right panel) conditions (see text for explanation of d′weight). Dotted line gives expectation for the data based on a constant level of internal noise.

