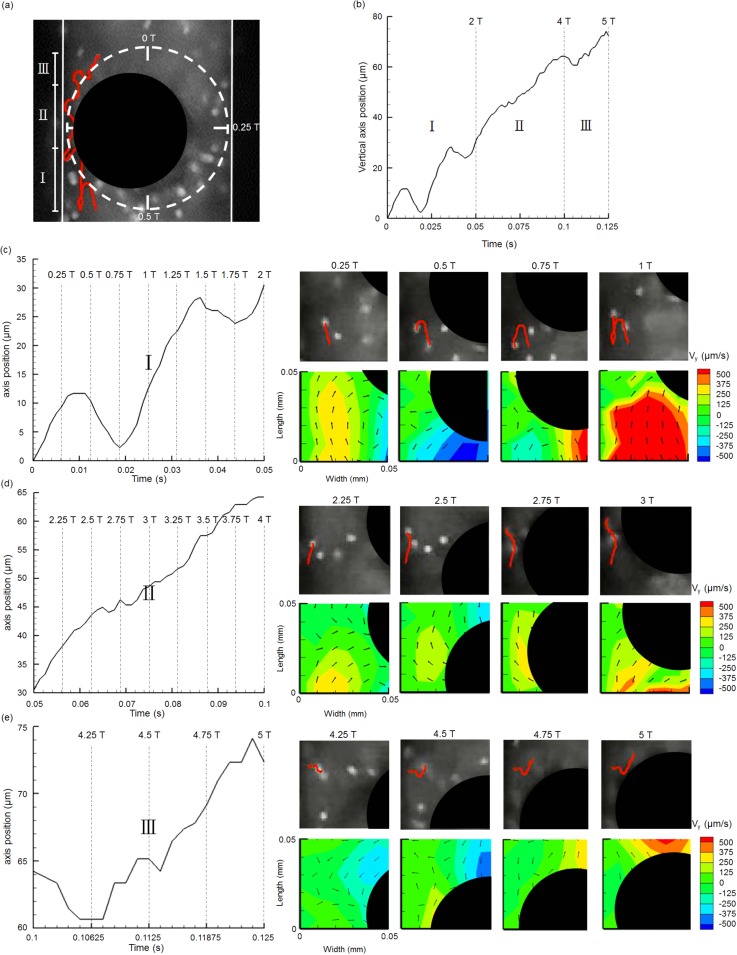
FIG. 6.
Instantaneous particle tracking results with corresponding surrounding flow fields quantified through μPIV. (a) Illustration of induced particle trajectory (highlighted in red) with three phases of action under a cyclic rotational motion of an artificial cilium (dark circle). (b) Three phases of action of the particle's trajectory were identified showing the relationship between the axial position of particle and time. Time periods for phases I, II, and III are 0.05, 0.05, and 0.025 s, respectively, which also correspond to two, two, and one rotational cycles of the artificial cilium (with rotational frequency of 40 Hz), respectively. Axial positions of the particle over time were plotted (left panel) with surrounding axial velocity maps provided (right panel) in phases I (c), II (d), and III (e).

