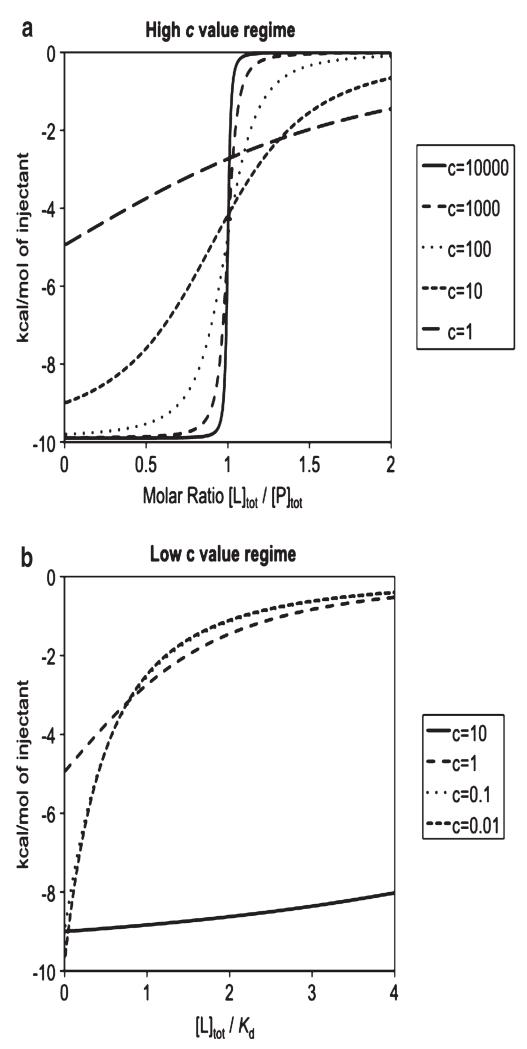
Fig. 5.
Experimental design for ITC under (a) high and (b) low c value regimes, showing typical sigmoidal and hyperbolic curves, respectively. The resulting ΔH (kcal/mol) is plotted vs. the molar ratio of total ligand and protein concentrations (a) and the ratio between total ligand concentration and the dissociation constant (b). The simulated curves assume a ΔH of −10 kcal/mol except the last two curves in panel b (c = 0.1 and 0.01) in which case the curves are magnified by factors of 10 and 100, respectively, to emphasize their similar curved shapes (35)

