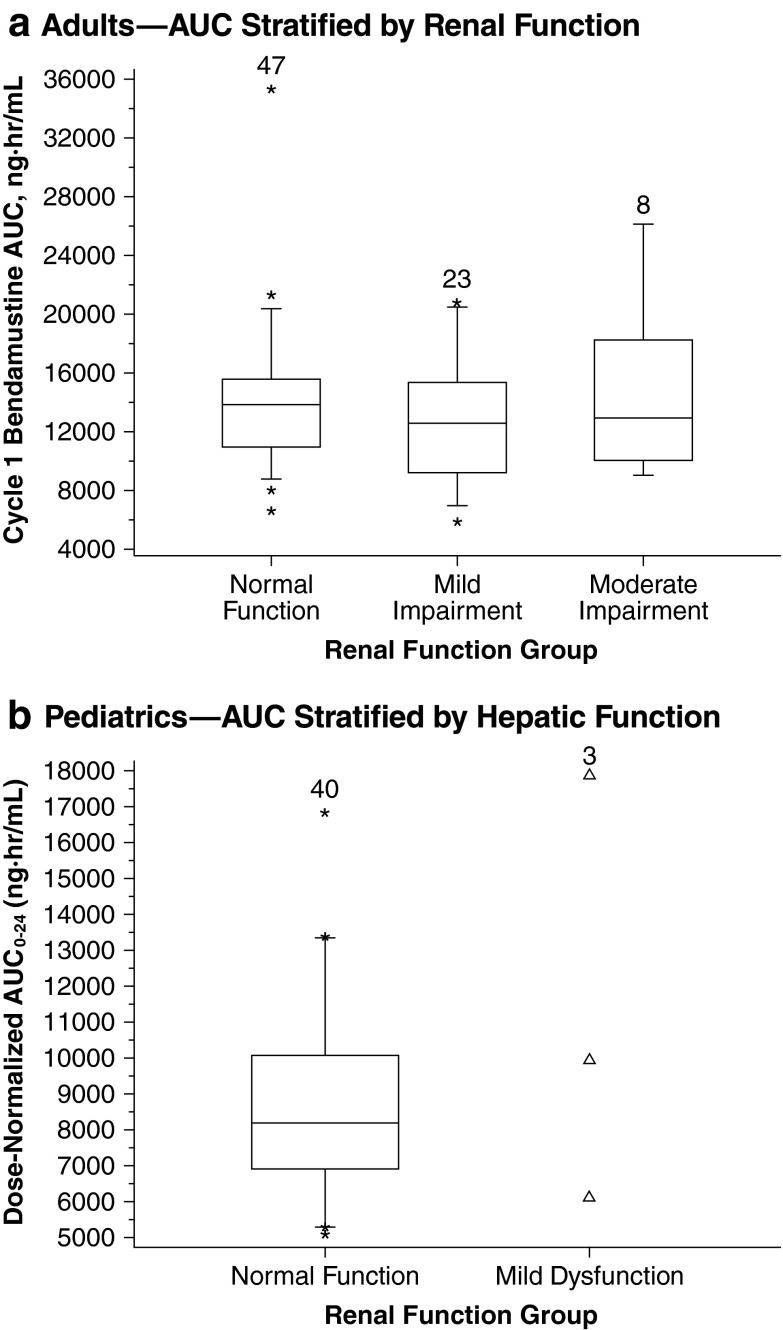
Fig. 5.
Effect of renal impairment on systemic exposure. Boxes are 25th, 50th, and 75th percentiles; whiskers are 5th and 95th percentiles. Asterisks are data points outside this range. Triangles show individual data points for patients with mild renal dysfunction. The numbers above the box represent the number of patients. Pediatrics panel: adapted with permission of Informa Healthcare [27]

