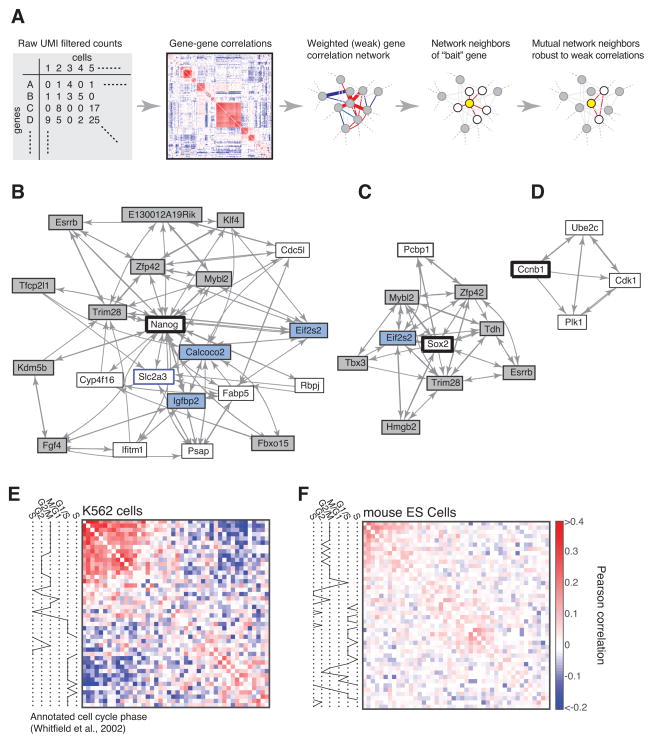
Figure 6. Regulatory information preserved in gene correlations.
A) A strategy for inferring robust gene associations from cell-to-cell variability with weak and/or highly connected gene correlations, see also Fig. S6. B-D) Gene neighborhoods of Nanog, Sox2, and Cyclin B. Grey boxes mark validated pluripotency factors; blue boxes mark factors previously associated with a pluripotent state. E,F) Correlations of 44 cell cycle-regulated transcripts in a somatic cell line (K562) and in mouse ES cells shows a loss of cell cycle dependent transcription in ES cells (gene names in Fig. S6). Genes are ordered by hierarchical clustering. Color scale applies to (E,F).

