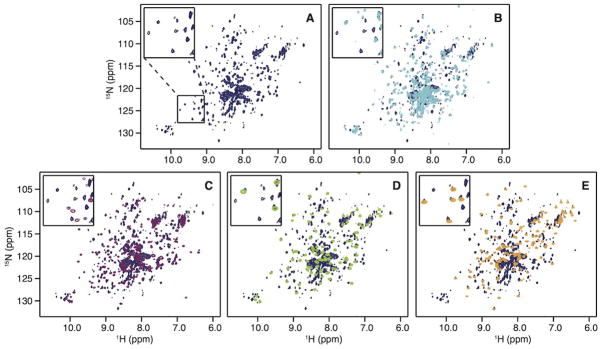
Figure 2.

1H-15N HSQC spectra of (A) p66 (dark blue), (B) p51 (cyan), (C) Palm-Finger (purple), (D) Thumb (green), and (E) RNH (orange). In (B)-(E), individual isolated domain spectra are superimposed on the p66 spectrum (dark blue). The insets depict expanded regions of the spectra as indicated in panel (A).
