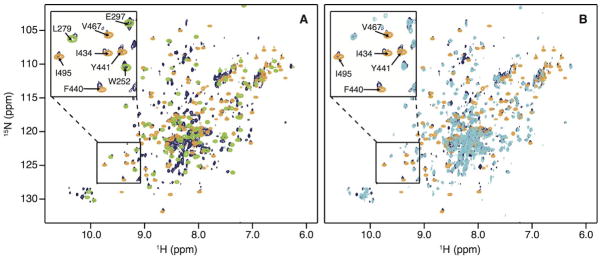
Figure 3.

Superposition of 1H-15N HSQC correlation (A) of the Thumb domain (green) and of the RNH domain (orange) onto the p66 spectrum (dark blue) and (B) of the p51 domain (cyan) and the RNH domain (orange) onto the p66 spectrum (dark blue). Several resonances are labeled with amino acid names and numbers in the insets.
