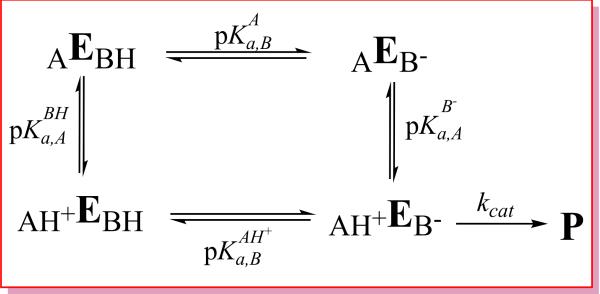
Scheme 2.
Microscopic general acid-base protonation state model used to interpret pH-activity data: AH+EB–, AH+EBH, AEBH, AEB– are four microstates. E stands for “enzyme” and subscripts A and B indicate the acid and base, respectively. The pKa shifts discussed in the text are defines as , and . Note the constraint of the thermodynamic cycle ensures ΔpKa,A,+ΔpKa,B=0, and a positive value for ΔpKa,B indicates anticooperative coupling of protonation states (i.e., protonation of the acid site disfavors protonation of the base), whereas a negative value of ΔpKa,B indicates cooperative coupling (i.e., protonation of the acid site favors protonation of the base). The “apparent pKa” model discussed in the text involves fitting of pH-rate data under the constraint that ΔpKa,A=−ΔpKa,B=0 (see text). This scheme does not consider the pH-dependence of substrate binding, which is also important for a complete kinetic characterization.

