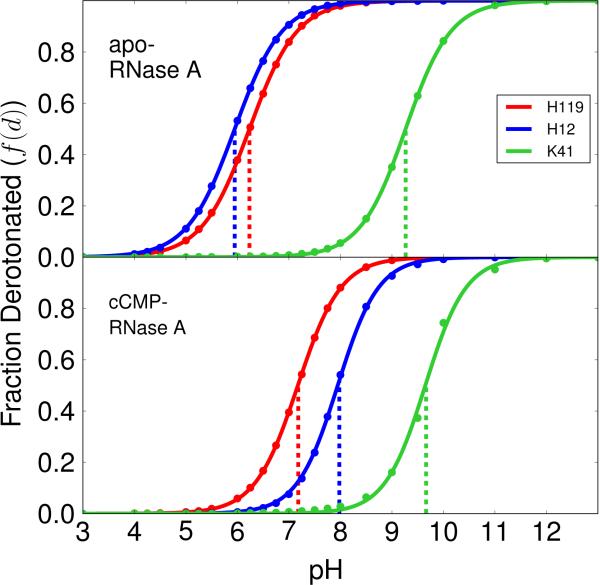
Figure 1.
Titration curves (lines) fitted to simulation data (points) with the Hill equation [Eq. (8)]. The upper panel represents the apo enzyme and the lower panel represents the cCMP-bound enzyme. The Hill coefficients for His119, His12 and Lys41 are 0.94, 0.94, 0.98 for the apo enzyme and 1.04, 1.09, 1.10 for the cCMP-bound enzyme, respectively.

