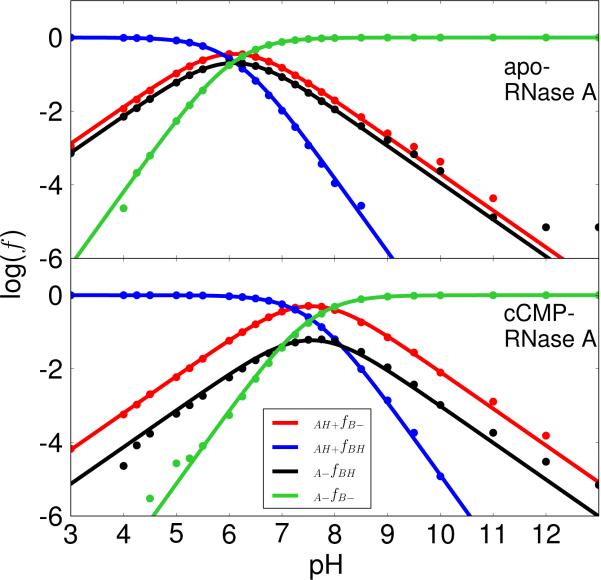
Figure 2. Microscopic pKa model results with H12/H119 acting as the general acid and base.
The plots of the logarithm of protonated fractions, log(f), versus pH of each microstate for apo (top) and cCMP-bound RNase A (bottom) were obtained by fitting the simulation data for all fractions to the equations derived from the microscopic model (Scheme 2) with His12/His119 acting as the general base/acid for apo RNase A (transphosphorylation model) and the general acid/base for cCMP-bound RNase A (hydrolysis model), respectively, as depicted in Scheme 1. The simulation data fits well with RMS errors of 0.22 (apo) and 0.17 (cCMP) for the log(f) values. The log(f) maximums (−0.45 and −0.30) for the curve of the active fraction, f(AH+/B–), are at 6.1 (apo) and at 7.5 (cCMP), respectively.

