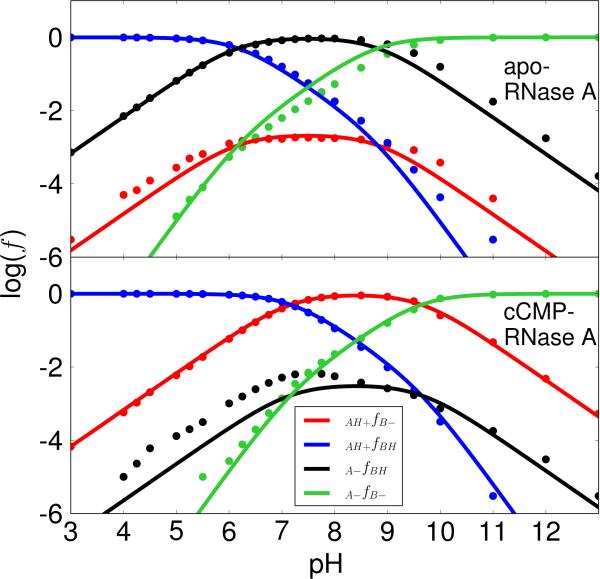
Figure 5. Apparent pKa model results with K41/H119 acting as the general acid and base.
The plots of logarithm of protonated fractions, log(f), versus pH of each microstate for apo (top) and cCMP-bound RNase A (bottom) were obtained by fitting the simulation data to ONLY the ACTIVE FRACTION (f(AH+/B–), shown in red) with Lys41/His119 acting as the general base/acid for apo RNase A (transphosphorylation model) and the general acid/base for cCMP-bound RNase A (hydrolysis model), respectively. This is not the generally accepted mechanism depicted in Scheme 1, but has nonetheless received some support in the literature24,40 and so is considered here for comparison. The model assumes no coupling of the microstates, and although only the active fraction is considered in the fitting (as would be the case experimentally), the parameters nonetheless are able to determine the other fractions which can be compared with the simulation data. The upper panel represents the apo RNase A and the lower panel represents the cCMP bound RNase A. The RMS errors for the log(f) values are 0.33 (apo) and 0.48 (cCMP) respectively. The log(f) maximums (−2.69 and −0.11) for the curve of the active fraction, f(AH+/B–), are at 7.5 (apo) and at 8.4 (cCMP), respectively.

